
At Pardus Consulting, we’ve just launched an online Jack-Knife Diagram (JKD) calculator that transforms downtime data into a clear, actionable visual.
By entering failure codes, counts of interventions and MTTR values, you’ll see at a glance which issues are both frequent and severe—no manual plotting or spreadsheet gymnastics required.
We’ve previously talked about this method as a much needed upgrade from Pareto Charts when prioritising downtime events and focus areas in our article HERE.
What Is a Jack-Knife Diagram?
Originally developed by Professor Peter Knights, the JKD plots the number of failure events against their mean time to repair on a log-log scale. Unlike a Pareto chart—where each bar represents cumulative downtime—this two-axis approach divides failures into four quadrants:
- Acute & Chronic: High frequency, high downtime events demanding top priority.
- Acute: Infrequent but time-intensive repairs.
- Chronic: Frequent but brief interruptions.
- Ideal Zone: Low frequency and low downtime—the target area
Why Use Jack-Knife Diagrams?
A Pareto chart often masks the true cost of “chronic” failures—those small but recurring disruptions that erode throughput and frustrate operations teams. Conversely, rare but lengthy outages can dominate downtime totals, drawing focus away from chronic problems. A JKD untangles these effects, enabling you to balance resource allocation between eliminating frequent hiccups and preventing major breakdowns.
The Importance for Reliability Engineers
For reliability engineers, the JKD is more than a chart—it’s a continuous-improvement compass. As your data set grows, the acute and chronic limits shift dynamically, spotlighting fresh opportunities for root-cause analysis and maintenance optimization.
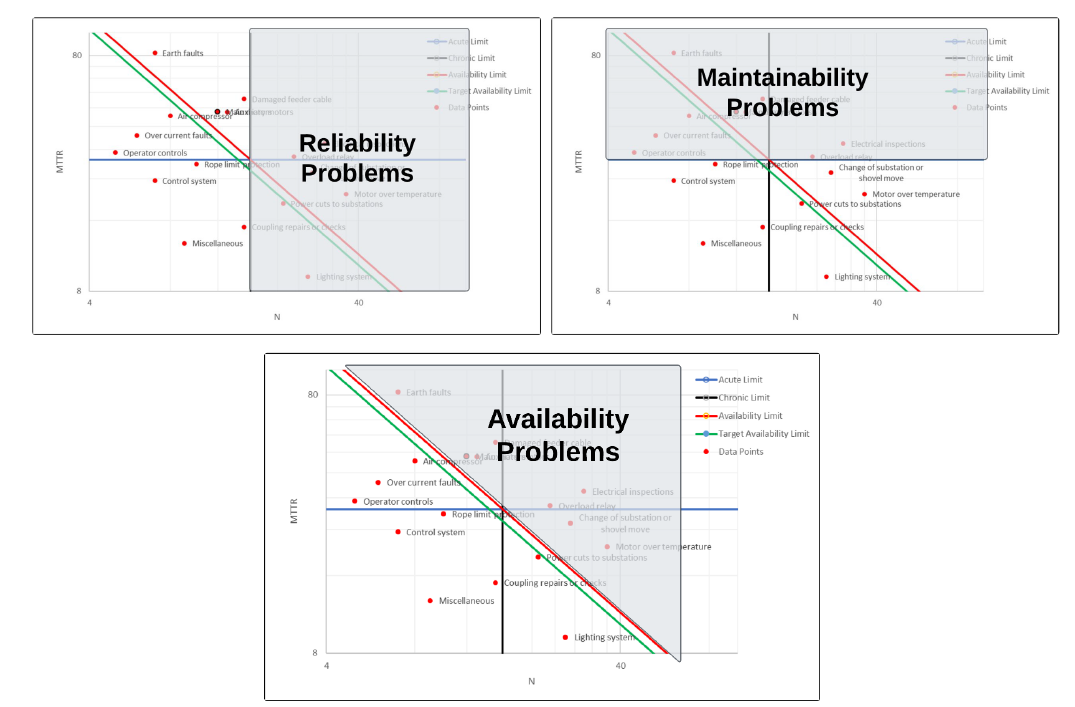
This web application not only gives you an interactive chart highlighting Chronic, Reliability, Maintainability, and Availability issues, but also exports it into detailed, professionally formatted reports with your company logo.
Try the Calculator Today
Whether you’re managing a single asset or an entire fleet, our JKD calculator cuts hours off the analysis phase and surfaces the downtime culprits that matter most. Upload your data and see how quickly you can turn raw numbers into reliability-improving actions.

Leave a Reply