Introduction
The analysis of telematics data with two or more parameters is a complex process. The analysis of multiple parameters using contour plots is a powerful tool since a lot of information is captured in the graphics.
The best results come from a team effort. For engineering data, the team may consist of the design/development engineers, a programmer, and a reliability engineer or a statistician. The following is an analysis of engine speed, engine torque, and the transmission gear state to describe the process.
Telematics Data
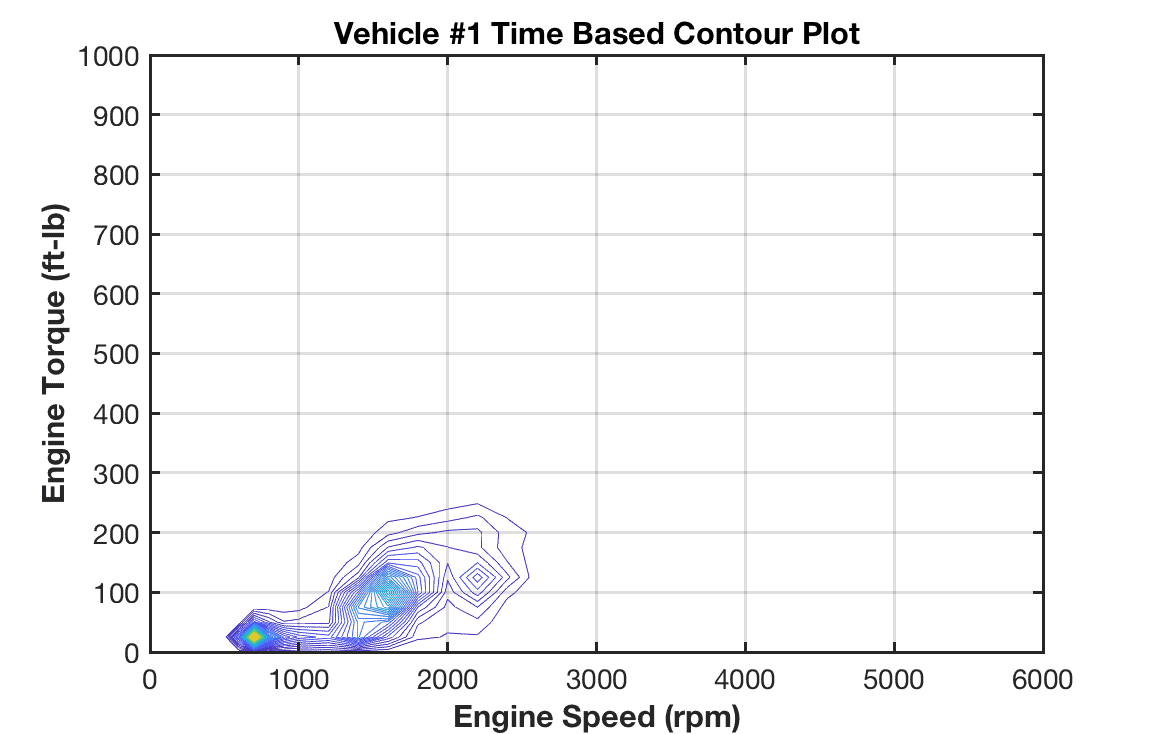
A telematics fleet consisted of eight similar customer vehicles with large engines. From a vehicle telematics file, the engine speed and engine torque data were extracted. The counts of 1-second data were binned into a table where the table cells represented a range of engine speeds and torques. The 1 second counts were converted to percent of the total time for the vehicle, and plotted as a contour plot. For example, vehicle 1 was monitored for 4,848 miles, generated 302,000 data records for 204 channels. The file size was 323 Megabytes. The contour plot is shown in figure 1.

Figure 1
From this plot, one can see that most of the operating time was spent in idle, about 600-700 rpm and low torque; in cruise mode, about 1,600 rpm and perhaps 50 ft-lb; and at higher accelerations, 2,200 rpm and 120 ft-lb. While the engine was capable of 6,000 rpm and 600 ft-lb, such customer extreme usage is a rare event.
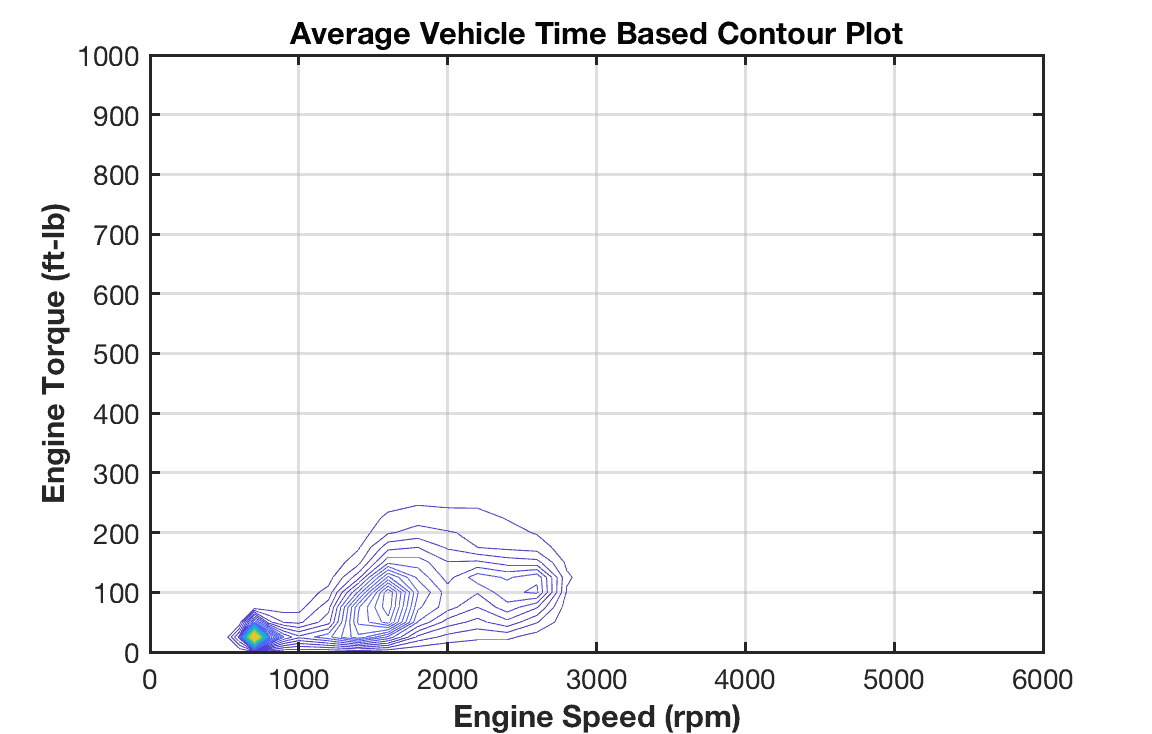
The results for the fleet of 8 vehicles were compared and the contour plots all showed similar customer usage for idle, cruise, and mild acceleration. The fleet average is shown in figure 2. Again, the extreme engine speed and torque were rarely used.

Figure 2
Second Level of Analysis
Capturing thousands of miles of fleet vehicle operation is interesting, but can this data be analyzed further? Engineers would be interested in the cumulative wear and/or cumulative fatigue damage experienced by different engine components. This analysis requires a detailed knowledge of the engine design and the appropriate analysis is different for different component types, i.e., bearings, crankshaft, rods, etc. When done for a fleet of vehicles, different customers will display different driving patterns with different component damage. In general the process is:
- Develop an analysis method to convert the engine speed x engine torque to a damage index.
- Perform the damage calculation for each vehicle in the fleet.
- Standardize the damage for different vehicle usage as damage per day, mile, year, or other unit.
- Identify a distribution to describe the damage index variation.
- Characterize the severe fleet usage, per corporate targets. This could be a 95th or 99th percentile usage.
Analyzing the transmission
The engine speed x torque data can be extended to the transmission. Each gear is operated for a fraction of the total vehicle usage. For a short time, the first gear is used when accelerating. However, on the highway, the vehicle will spend a lot of time in the highest gear. Dividing the engine speed by the gear ratio and multiplying the torque by the gear ratio obtain gear specific speeds and torque. The engineer’s detailed knowledge about the gear design allows the gear tooth stresses to be calculated and the speed provides a cycle counts. Fatigue damage calculations use the gear stress and cycles to calculate fatigue. Finally, the results would be scaled to a common metric, i.e., cumulative damage per day, per mile, per year…
The fleet of vehicles would be analyzed and the results for specific engine and transmission components would be summarized with a set of damage indices. The damage indices for a fleet of vehicles could be analyzed to determine a damage distribution for the respective components.
Other Comparisons
Additional value comes from comparing a customer fleet to dynamometer test. Generally, a dynamometer test is run at high speed and high load profiles to accelerate the test. A comparison of damage indices could indicate if the dynamometer test is appropriate to describe severe customer usage.
Vehicle development fleets generally run specific road courses. Similar data from the development fleets are compared to customer usage, again to critique the value of specific development fleet courses.
Conclusions
Cross-functional teams can effectively analyze telematics data. The results from customer vehicles can be compared to development vehicles and to other engineering tests. This provides useful feedback to the design and development process. Both the product, in this case engines and transmissions, can be improved and the development process optimized.
If you want to engage me on this or other topics, please contact me. I offer a free hour for the first contact to discuss your problem/concerns and to determine how I can help you.
I have worked in Quality, Reliability, Applied Statistics, and Data Analytics over 30 years in design engineering and manufacturing. In the university, I taught at the graduate level. I provide Minitab seminars to corporate clients, write articles, and have presented and written papers at SAE, ISSAT, and ASQ. I want to assist you.
Dennis Craggs, Consultant
810-964-1529
dlcraggs@me.com
 Ask a question or send along a comment.
Please login to view and use the contact form.
Leave a Reply