One of my standing searches revealed an article that has shows a nice example of reliability data analysis. The author analyzed the time-to-violent-death of Roman emperors. The article is interesting in a historical sense plus illustrates a few key points for any life data analysis.
The article, “Statistical reliability analysis for the most dangerous occupation: Roman Emperor” by Joseph Homer Saleh takes a look at the 69 Roman emperors and 62% of them that suffered a violent death. The idea of the study was to determine if there is some pattern to the deaths and if the analysis would reveal any insights for those studying the era of the Roman emperors.
Becoming an emperor seems to have some benefits, as well as mortal risks. The analysis uses a reasonable approach and distribution fitting. The analysis revealed a mixed Weibull adequately described the data. Here’s a PDF of the mixed distribution result.

The Analysis Approach
Saleh starts the analysis with the data, 69 emperors’ time in power and the nature of death. The deaths due to old age were not deemed violent and treated as censored data. Then he details the data analysis using both a Kaplan-Meier and Weibull distribution.
The key element here is the reasons to look at the data. The analysis of the data is to determine if there was some pattern or underlying structure to the violent deaths of about 62% of the rulers. The analysis is not done just because or for no particular reason. The author wanted to detect some information in the data.
The same should be true for any data analysis you conduct. Be very clear on what question you are addressing or exploring. Write it down, make it clear.
The Analysis Results
The author’s analysis does find a structure or pattern to the deaths, which is great as a random time to failure would not be all that satisfying (see my writing on NoMTBF.com). The dataset in the study like so many datasets we analyze do not have an underlying flat, equal probability of failure per unit time, structure.
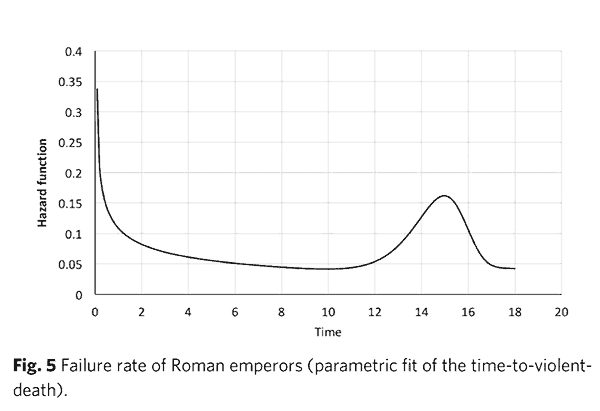
The author finds the first couple of years were particularly risky and an early life failure pattern emerged. If an emperor survived the first year, they enjoyed an increased chance of surviving the second year. This would suggest those that were either lucky or paid particular attention to their security during the early part of their rule survived to rule longer.
A deeper look into the lives of quickly perished emperors suggests a few traits to explain the pattern. Such as being weak rulers incapable of handling the demands of ruling the empire and their own security.
The data also shows an increase in the hazard rate after about 10 years of rule. The author speculates the rulers felt secure and let down their guard. Or, the ruler’s simply wore-out, became more fatigued along with a possible increase in the harshness of their environment.
The key element here is the analysis of the data provided insights based on the pattern revealed. The author didn’t find detailed causation in the data alone. The data analysis prompted additional questions that allowed the investigator to draw conclusions and to ask better questions. As with your analysis, while we are looking for answers to our questions, it is the prompting of better questions that often have the most value.
A Rich Dataset
More than half the emperor’s died a violent death. Let’s hope that datasets (your products and systems) do not incur such results. The article’s data was on the lives of 69 Roman emperors, not a lot of data. Yet with a clear objective or question along with careful analysis revealed meaningful patterns that assisted the research into the history of Roman emperors.
With every analysis, start with a clear question or hypothesis. Use the data well. And remember that results will likely only reveal more questions – better questions, which is good.
 Ask a question or send along a comment.
Please login to view and use the contact form.
Leave a Reply