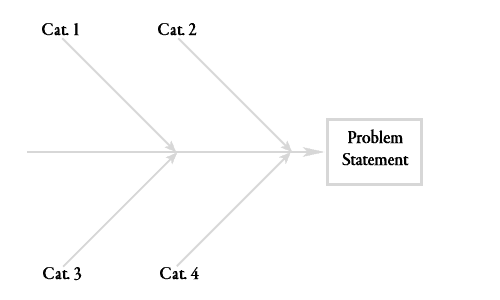
Also called the Ishikawa or fishbone diagram, the cause and effect diagram is a graphical tool that enables a team to identify, categorize, and examine possible causes related to an issue. The intent is to expose the most likely root causes for further investigation.
This diagram is part of a complex failure analysis process when there are many potential causes for the problem or condition. Similar to a brainstorm session about the problem, this graphical tool provides a bit of structure and may prompt additional potential causes.
The Ishikawa diagram is one of the seven basic tools of quality control.
Benefits of a Cause and Effect Diagram
There are four significant benefits to using a fishbone diagram with a team, or even on your own.
- It helps to avoid anchoring. One issue with any brainstorming process is the early ideas become a focal point for future ideas. The fishbone diagram starts with categories of potential causes. This helps you and the team think about the range of different potential causes of the problem.
- It is visual. This process is inherently visual and uses a simple branching structure to quickly organize potential causes. At first, the ideas flush out the categories and may include secondary (or more) branches from the initial ideas along a similar line of reasoning.
- The diagram captures the current thinking around a problem. It not only captures all the possible causes it also organizes them into categories and subcategories.
- Focuses the team on causes and not symptoms. Engineers seem to be ready to solve symptoms without first understanding the root causes. This tool really only focuses on one question: What is a cause of this problem?
Steps to Create a Cause and Effect Diagram

- Start with a basic fishbone diagram as above. the box with the problem statement is to the right (taking advantage of time progress to reinforce the causes, which occur before the problem occurs).
- Write a clear problem statement. Include a title or summary in the box on the diagram, yet capture the complete problem statement elsewhere. Include elements such as who, what, when, where, and how much in the full problem statement. Be specific. Make sure everyone fully understands the problem statement.
- Add four to six (or as many as appropriate ‘bones’ or primary branches to the diagram. List the major categories for potential causes. A common set may include:
- Material
- Measurement
- Methods or procedures
- Machines or equipment
- Manpower (people, staying with M words here)
- Environment (some use Mother Nature)
Use as few or as many as necessary. If during the process a new category emerges simply add another primary branch.
- Given the problem, start the brainstorm session by asking “why does this happen?” Write down the cause by adding a branch to the appropriate primary branch. Ask ‘why does this happen again for that causes and add sub-branches as needed for the suggested causes. Think ‘5 Whys’ method here to drill down to fundamental or root causes.
- Continue to add causes and asking why till all causes are recorded.
- Re-set thinking by shifting focus to a category that has only a few potential causes.
- Capture notes on necessary additional information, potential experiments, etc as to not slow down or distract the process of listing causes.
- With a large assortment of potential causes, the next step is to narrow down the potential causes to investigate. There might be an obvious few causes that are most likely to be the root cause(s) of the problem, in which cases pursue those ideas. If it is not clear, ask the group to estimate the likelihood of the cause leading to the problem, the pursue the most likely. Another technique to narrow done candidate ideas to investigate is multi-voting.
- Work toward solving the problem and revise the diagram as new information becomes available or initial causes investigated did not lead to a solution for the problem. The underlying causes may be not obvious or a cause that is less likely than others.
Best Practices
Get consensus on a very clear problem statement if it doesn’t exist already. This helps keep the focus on causes that lead to the same problem.
Be flexible with the major categories and adjust them as needed to fit the circumstances of the particular problem.
It is a brainstorming session, therefore, refrain from critiquing or judging causes as they are suggested. There is time later to filter the frivolous suggestions, yet those suggestions may spark the line of thinking that leads to an elegant solution.
Avoid using a computer screen that limits the visibility of the entire diagram. Instead, use a large white board or wall covered in paper. Make the entire diagram visible to the entire tea.
Summary
Enjoy the process. It should be fun and quick.
Fishbone diagraming is a useful tool when working to identify root causes of a problem during a root cause investigation with a team.
It adds a bit of structure to brainstorming and reinforces the focus on causes and not symptoms.
Finally, if you have or know of a great set of examples of fishbone diagrams and are willing to share them with this article, please send them over.
 Ask a question or send along a comment.
Please login to view and use the contact form.
Leave a Reply