
Spot component failures before they happen using thermal imaging. Every component failure has a classic signature, a fingerprint. Observing this fingerprint overtime displays the type of impending failure and what actions to take now to prevent expensive unplanned downtime.
Have you ever seen a component look fine only to have it fail without warning?
Chances are that the heat told the story first. Thermal imaging is one of the most powerful tools in the Non-Destructive Testing (NDT) toolkit. It turns invisible heat patterns into actionable insight and when used right, thermal imaging can detect component problems before they lead to catastrophic failure days or even weeks before they happen.
In this article, we will address the following:
- What thermal imaging reveals about motors, gears, bearings, and pumps
- Why migrating hotspots are a red flag you can’t ignore
- How to turn thermal profiles into predictive action
Thermal Imaging for Predictive Maintenance
In the world of predictive maintenance, thermal imaging has emerged as one of the most powerful and accessible non-destructive testing (NDT) methods available. Unlike other forms of NDT that require direct contact or disassembly, this method allows us to spot component failures before they happen using thermal imaging to provide insight into the health of equipment without interrupting operations.
When deployed intentionally, thermal imaging can spot component failures before they happen by observing the fingerprint of the component and comparing it to the expected thermal signature. The deviation in thermal signature will identify the type of failure. When performing routine thermal imaging on the same component overtime, we can identify the expected end-of-life and plan around the impending failure. This is how thermal imaging becomes a cornerstone of a reliability strategy. Whether implemented as part of a Total Productive Maintenance (TPM) initiative or within a Reliability-Centered Maintenance (RCM) framework, it enables teams to detect early failure conditions, prevent unplanned downtime, and extend the life of critical components.
Where to Begin: Targeting Heat-Sensitive Components
Thermal imaging is most effective when focused on assets that are vulnerable to heat-related degradation. These typically include bearings, gears, pumps, motors, compressors, and rollers. These components naturally generate heat through friction, electrical resistance, or fluid dynamics. It is this heat that allows us to spot component failures before they happen using thermal imaging.
Limitations of Thermal Imaging
Thermal imaging is a powerful early warning tool, but it does not detect all failure types and should not be used as a standalone diagnostic method.
Infrared thermography measures surface temperature differences, not internal component conditions. It cannot directly detect subsurface cracks, early fatigue damage, internal corrosion, or material defects unless those issues alter surface heat patterns. Many failure modes including lubrication contamination, early bearing spalling, and shaft crack initiation often show no thermal signature in early stages. (For more on 5 stages of failure lifecycle visit our site www.masterreliaiblity.com) or stay tuned for future articles.
Thermal images also do not identify root cause. Elevated temperature indicates a symptom, but additional methods such as vibration analysis, oil analysis, ultrasound, or electrical testing are required to determine the underlying failure mechanism.
Accuracy can also be affected by emissivity differences, reflective surfaces, airflow, weather conditions, insulation, and environmental heat sources.
Best Practice:
Thermal imaging should be integrated into a broader condition-monitoring strategy rather than relied upon as a single-source diagnostic tool.
Bearings
Thermal imaging can detect bearing problems before they lead to catastrophic failure. Thermal patterns on bearings often reveal asymmetrical heating, indicating shaft misalignment, poor lubrication, or excessive load. Early detection of heat buildup around the raceway or seals can prevent catastrophic failure and reduce replacement costs.
| Pattern Location | Visual Cue | Likely Issue |
|---|---|---|
| Center hotspot (inner ring) | Bright central glow | Lubrication failure, excessive friction |
| Outer ring hotter than inner | Ring-shaped gradient | Misalignment, housing distortion |
| One side hotter (axial) | Gradient from left to right | Shaft misalignment, uneven load |
| Radial gradient (top to bottom) | Vertical heat band | Vertical heat band |
| Irregular patchy hotspots | Scattered bright spots | Contamination, wear debris, electrical discharge |
| Cool housing, hot bearing | Sharp contrast | Poor thermal contact, insulation, hardened grease |
Gears
Thermal imaging can detect gear problems before they lead to catastrophic failure by observing Abnormal heat signatures on gear teeth or shafts can indicate misalignment, improper meshing, or lubrication failure. Left unaddressed, these conditions can result in tooth wear, vibration, and eventual loss of mechanical power transmission.
| Pattern Location | Visual Cue | Likely Issues |
|---|---|---|
| Tooth flank hotspot | Bright stripe along gear tooth face | Misalignment, excessive backlash, uneven contact stress |
| Root of gear tooth heating | Localized glow at tooth base | Bending fatigue, overloading, inadequate root relief |
| One side of gear hotter | Heat concentrated on one gear face | Shaft misalignment, axial loading imbalance |
| Heat near gear hub | Centralized hotspot around bore/hub | Bearing failure, improper mounting, shaft interference |
| Ring of heat across diameter | Uniform outer ring pattern | Over-tension, excessive preload, thermal growth imbalance |
| Intermittent spot hotspots | Scattered thermal dots on gear face | Contamination, pitting, wear debris, incipient spalling |
| Entire gear uniformly hot | Full gear face evenly heated | Overload, improper lubrication, high ambient temperature |
Pumps
Thermal hotspots around seals, impellers, or motor couplings may signal clogging, cavitation, or dry running. Early identification helps maintenance teams intervene before internal damage leads to a full breakdown.
| Pattern Location | Visual Cue | Likely Issues |
|---|---|---|
| Pump casing hotspot | Bright area on outer pump body | Internal cavitation, impeller friction, excessive internal wear |
| Seal area hotspot | Localized bright ring at shaft seal | Seal failure, misalignment, dry running |
| Bearing housing heat band | Horizontal or radial glow at bearing ends | Lubrication loss, overloading, bearing wear |
| Motor end hotter than pump | Thermal gradient from motor to pump | Shaft misalignment, coupling imbalance |
| Uneven temperature left-right | Gradient across pump housing | Uneven wear, flow imbalance, internal obstruction |
| Discharge hotter than suction | Progressive heat from suction to outlet | Blocked discharge, recirculation, excessive head pressure |
| Intermittent spots on body | Scattered thermal dots on casing | Scale buildup, debris, or internal corrosion |
| Uniform high heat across pump | Entire body shows elevated, even heat | Overloading, prolonged operation, inadequate cooling/lubrication |
Motors
Thermal imaging can detect overheating in windings, uneven temperature across stator/rotor zones, or excess heat in end bells. These indicators often point to phase imbalance, overload, or electrical insulation failure.
| Pattern Location | Visual Cue | Likely Issues |
|---|---|---|
| Center of housing hotspot | Bright core or hotspot in motor body | Stator winding overheating, overloading, insulation failure |
| End bell heat concentration | Glow near bearing housings or end bells | Bearing failure, shaft misalignment, excessive preload |
| One side of motor hotter | Asymmetrical temperature gradient | Uneven phase load, airflow blockage, internal imbalance |
| Terminal box hotspot | Heat concentrated at electrical terminals | Loose connections, corrosion, phase imbalance, arcing |
| Coupling area hotspot | Local glow around shaft or coupling zone | Misalignment, excessive vibration, mechanical overload |
| Vent blockage pattern | Vent blockage pattern | Cooling fan failure, clogged vent, poor airflow |
| Entire motor evenly hot | Uniform high-temperature across housing | Continuous overload, undersized motor, ambient heat influence |
| External stripe patterns | Horizontal/vertical bands on casing | Phase imbalance, partial winding shorts |
Compressors
Excessive heat in discharge heads or cylinder walls may signal valve leakage, over-compression, or internal wear. Monitoring these thermal patterns over time can help isolate and correct inefficiencies before pressure loss or shutdown occurs.
| Pattern Location | Visual Cues | Likely Issues |
|---|---|---|
| Head/cylinder hotspot | Bright spot on top or cylinder area | Valve leakage, over-compression, carbon buildup, excessive discharge temp |
| Discharge line glowing | High temp gradient at discharge pipe | Overheating due to high head pressure, restricted discharge flow |
| Suction line cooler than body | Noticeably cooler inlet line | Potential suction restriction or liquid slugging |
| Motor section hotspot | Central heat glow around motor housing | Motor overload, poor ventilation, bearing failure |
| Compressor body asymmetry | One side hotter than the other | Internal component wear, unbalanced operation |
| Bearing housings localized heat | Glow at shaft ends or bearing locations | Glow at shaft ends or bearing locations |
| Intercooler/exchanger heat band | Heat build-up across cooling system | Fouled heat exchanger, insufficient airflow, scaling |
| Oil sump or separator overheating | Localized hotspot near oil reservoir | Low oil level, oil degradation, clogged oil separator |
Rollers and Idlers
Localized heating at bearing ends or across the roller surface may suggest axial misalignment, bearing seizure, or belt tracking problems.
| Pattern Location | Visual Cues | Likely Issues |
|---|---|---|
| Center of roller hotspot | Bright glow in the middle of the roller | Internal bearing failure, misalignment, belt tension imbalance |
| End cap localized heat | Bright spot at roller ends | Bearing wear, lack of lubrication, shaft misalignment |
| One side of roller hotter | Asymmetric temperature gradient | Belt tracking issue, uneven loading, bearing preload mismatch |
| Entire roller uniformly hot | Entire roller uniformly hot | Over-tensioned belt, friction overload, continuous duty without cooling |
| Patchy spots along surface | Scattered thermal anomalies on roller face | Build-up of debris, surface wear, coating failure |
| Idler frame or housing hotspot | Heat at idler brackets or mount points | Friction from misaligned installation or bearing binding |
| Roller-to-belt contact hotspot | Hot zone at belt contact region | Belt slippage, material buildup, excessive drag |
| Vertical stripe pattern | Vertical stripe patternVertical stripe pattern | Imbalanced load distribution, possible shaft distortion |
Understanding the Migrating Hotspot
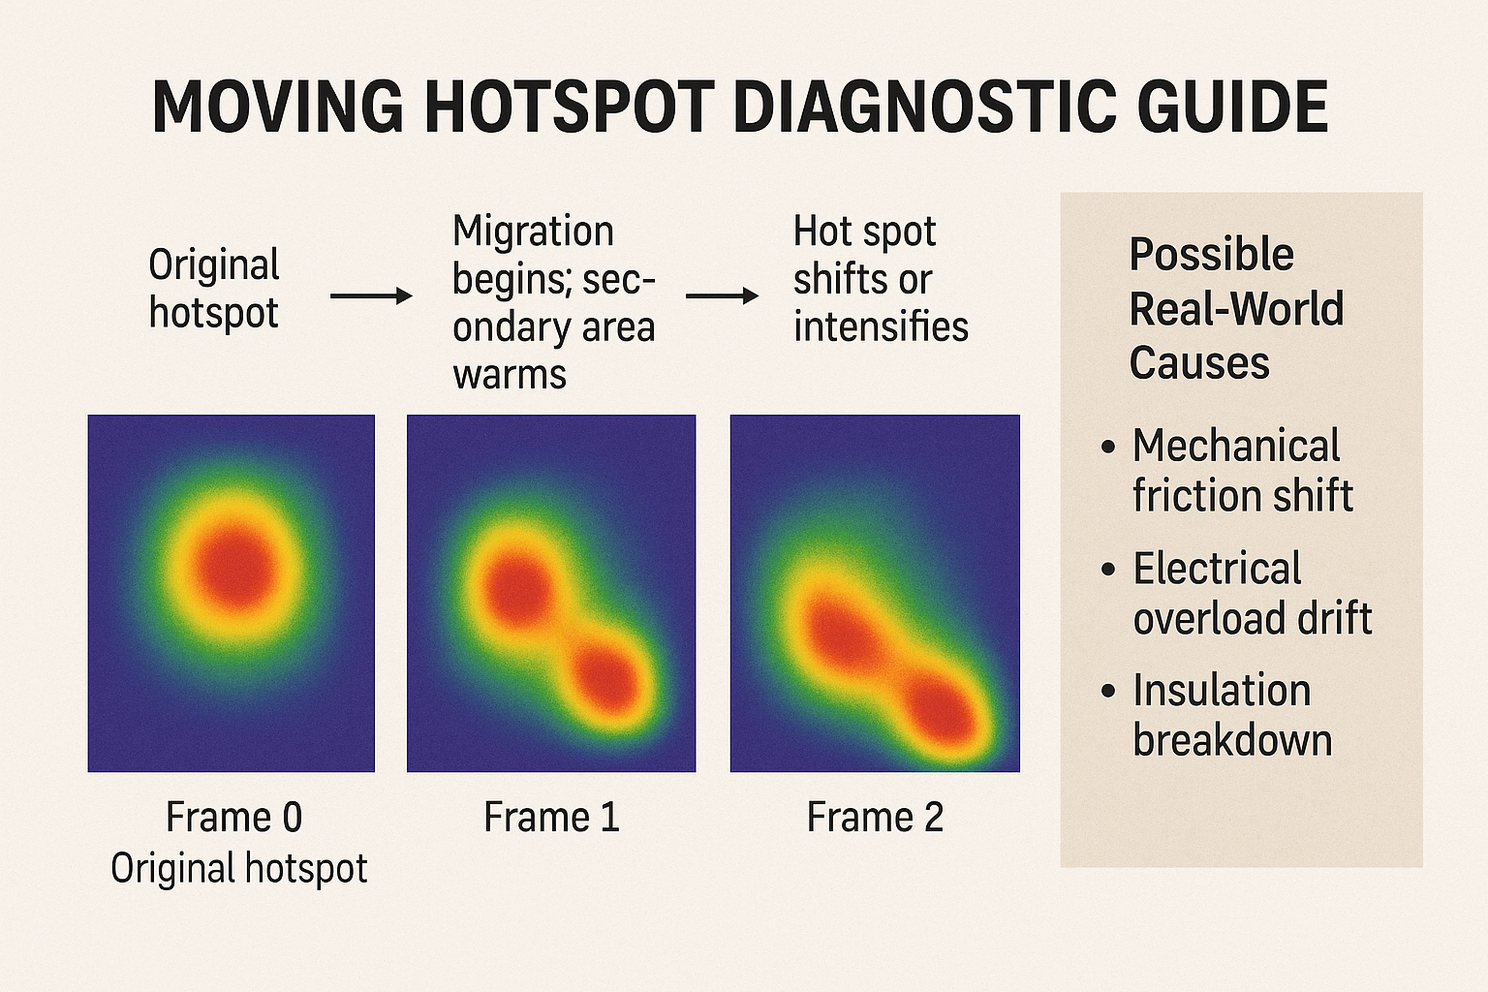
While static hotspots are important, one of the most telling thermal patterns is the migrating hotspot. A condition where heat intensity shifts over time. Unlike a single, stable anomaly, a migrating hotspot reflects dynamic deterioration. It indicates that the problem is not stationary, but evolving either mechanically, electrically, or thermally.
In our thermal profile analysis, we observed a classic progression of this condition. Initially, heat was concentrated in a central location. As time progressed, a second hotspot developed and intensified, eventually overtaking the original.
This type of profile tells us something critical: the condition is not stable. The problem with the equipment is transitioning, and likely accelerating, toward failure.
What a Migrating Hotspot Can Indicate
Depending on the component involved, a migrating hotspot may point to several underlying issues:
- Mechanical Friction Shift: A bearing or gear begins to wear, and the resulting heat follows the rotation or load path. This may suggest misalignment or a lubrication issue.
- Electrical Load Migration: Current begins to concentrate through weakened conductors, often due to poorly connected terminals or degraded connections. The heat signature moves with the electrical imbalance.
- Thermal Runaway or Insulation Breakdown: In batteries, heating elements, or capacitor banks, localized heat may expand as insulation weakens, or thermal control fails, leading to self-reinforcing failure conditions.
Understanding this thermal behavior is crucial. A single snapshot may catch a problem, but tracking thermal behavior over time tells a far deeper story, one of system behavior, load fluctuation, and progressive failure.
Visualizing the Pattern
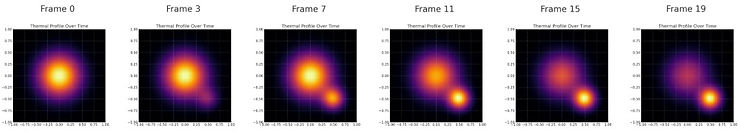
The example above shows six frames from a thermal imaging video. A concentrated hotspot appears early in the sequence. Over time, a second heat zone develops and grows in intensity. Eventually, the thermal load shifts completely to the new location.
This progression is often seen prior to bearing seizure, insulation failure, or shaft misalignment, each representing conditions that traditional inspections may miss.
Keys to Successful Thermal Imaging Use
To achieve reliable results, thermal imaging must be performed with awareness of the variables that influence accuracy. These include:
- Emissivity: Always adjust the emissivity setting for the surface material being scanned. Reflective materials like polished metal can distort temperature readings.
- View Angle: Images should be taken as close to perpendicular to the surface as possible. Angled views reduce the accuracy of the thermal profile.
- Environmental Reflections: Be cautious of nearby heat sources, lights, or surfaces that may reflect thermal energy onto the object being scanned.
Thermal imaging is not just a tool it is a diagnostic discipline. When used consistently and interpreted correctly, it becomes a vital part of any modern maintenance program.
Conclusion
Thermal imaging can detect component problems before they lead to catastrophic failure. Thermal imaging offers more than just a temperature reading, it offers insight into the health, function, and future failure risks of your equipment. By targeting key components and learning to interpret thermal progression, maintenance teams can catch failures before they occur, optimize PM schedules, and drive operational excellence.
If your facility is looking to implement or enhance a thermal imaging program, the time to start is now. Begin with your most critical assets, educate your teams on thermal behavior, and monitor not just what’s hot, but how it changes over time. Because in equipment reliability, heat always speaks first.
Join us on our YouTube channel for the free lecture: Thermal Expansion & Shaft Failure — Explained! 🔥 LS-005

Leave a Reply