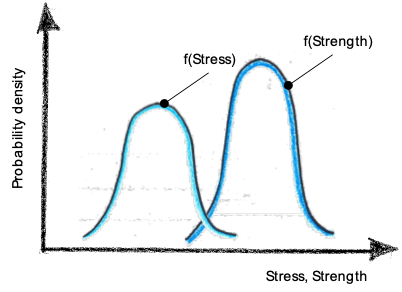
Since I published my first contribution about reliability, I’ve received a number of emails asking where the stress and strength distributions come from (Figure 1).

I’ve realized that reliability engineers tend to take this concept for granted generating uncertainty in those who approach this topic for the first time. In this article I want to answer this basic question about reliability.
Let’s consider that we want to assess the mechanical resistance of a public garden bench. If nobody is sitting on it, the bench is not exposed to any load. Hence, it will not fail (Figure 2).

Now, let’s assume that someone is sitting on it (Figure 3). Due to his/her weight, the person is generating a stress in the bench. If the induced stress is greater than the strength of the bench, the bench will fail.

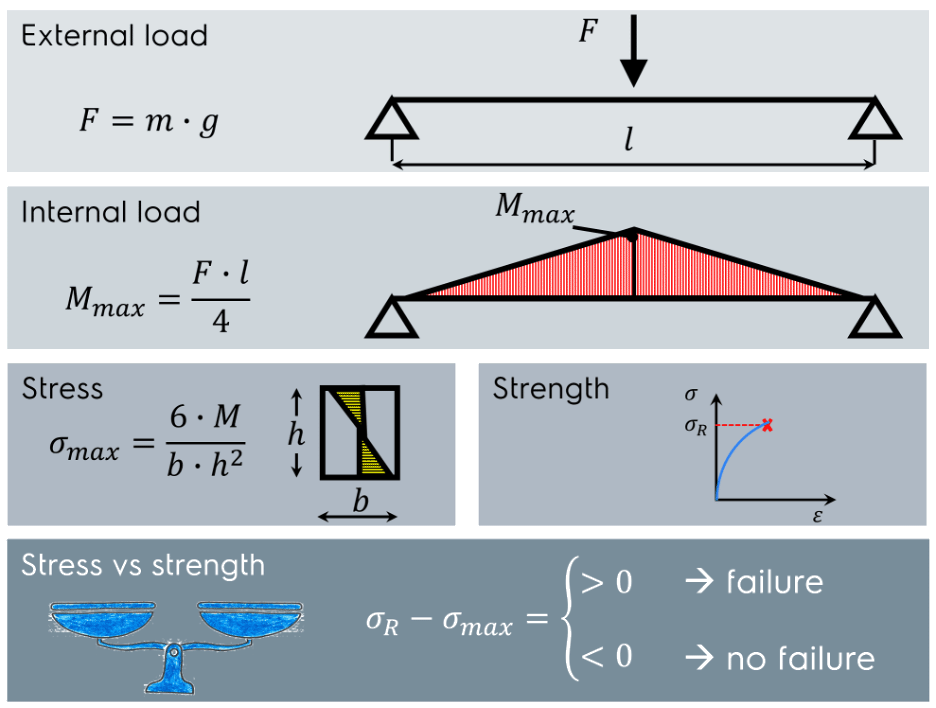
Let’s assume that the bench can be modelled as a simply supported beam with center load. The cross section of the beam is rectangular. Figure 4 shows the procedure for calculating the mechanical resistance of the bench when stress and strength can be defined in a deterministic manner. The force induced by the person sitting on the bench is converted first into bending moment and then into mechanical stress. If the stress is lower than the strength of the bench, it won’t fail. The strength is the resistance of a standardized specimen subjected to tensile load until failure. For the sake of simplicity, I’ve used the maximum principal stress criterion.

It is worth noting that the in case of a deterministic approach as such shown in Figure 4, we cannot use the expression “reliability evaluation”. Instead the procedure shows the evaluation of mechanical resistance. This is because reliability is a statistical concept by definition. Reliability is defined as a probability.
Indeed, when we design a product, we generally expect that it will be used at least by a certain number of different users if not by anyone. The same applies to the bench. We expect that anybody can sit on it. Human weight varies. This variation can be modelled by a statistical distribution (Figure 5). The distribution of the mass can be converted into a stress distribution. Great! We have derived the first curve of the famous graphical representation shown in Figure 1.

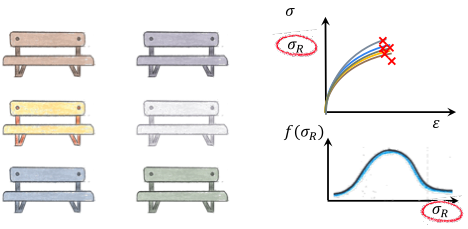
Let’s deal with the strength distribution. The strength of the bench is derived experimentally. Specimens are tested applying a tensile stress until failure. Even in this case, if we test multiple samples, we won’t achieve the identical static strength value for each specimen i.e. the strength is statistically distributed (Figure 6).

If we plot the stress and strength distributions in the same chart we obtain the graph shown in Figure 1. Having both distributions enables us to calculate reliability according to the stress-strength interference theory. If the reader wants to know how to apply the stress-strength interference theory he/she might care to read the following article (Calculation of Reliability Using the Stress Strength Interference Model (accendoreliability.com)).
This analysis is straightforward but contains some pitfalls that I’m going to discuss in separate articles on the Accendo Reliability website.
- I’ve represented stress and strength as normally distributed quantities. This is not always true. For example, fatigue strength values generally follow a log-normal distribution. Analysis of fitting distribution for stress and strength is needed.
- If we calculate reliability applying the stress-strength interference theory, we should be sure that these quantities are consistent each other. Consistency is given by the damage mechanism.
Stress and strength might be affected by a plenty of factors such as temperature, humidity geometric tolerances, manufacturing process, etc. The task of reliability engineers is to identify these parameters and propose design guidelines aimed to impact reliability.
 Ask a question or send along a comment.
Please login to view and use the contact form.
Leave a Reply