You have been put in charge of a program to study failure rates of brake pads. The place to start is a testing program that will generate data for analysis.
Testing programs should begin with a specific intent. This may be to characterize quality based failures, use life, or wear-out failure modes. When a test is complete it is easy to take all observed failures and use them in the data set to characterize the failure mode. This is a mistake.
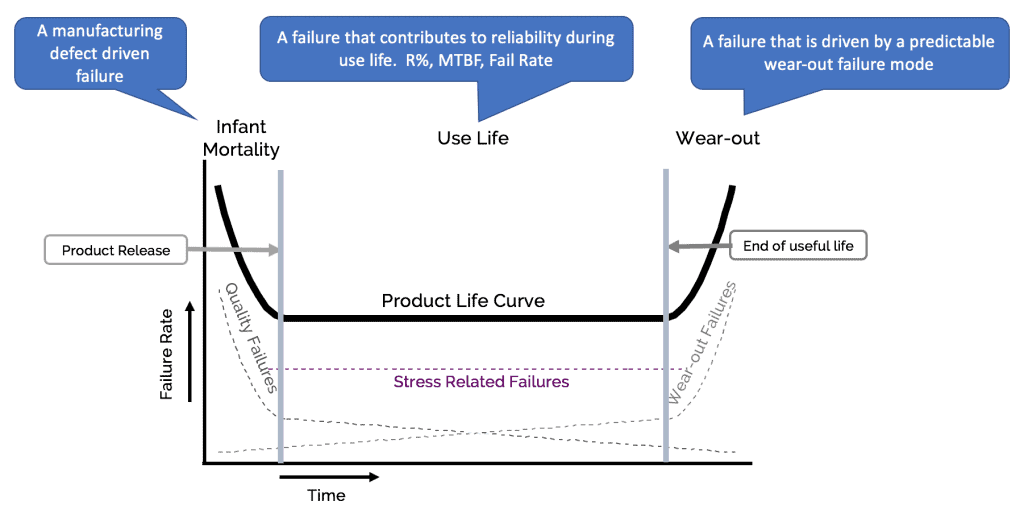
Each of the study intents I described above can be attributed to wanting to understand a specific section of the life curve that is commonly represented by the “bathtub” curve.
The three phases of the bathtub curve are, Infant Mortality, Use Life, and Wear-out. Each are driven by specific factors. By root causing the observed failures from testing they can be grouped with the corresponding life phase. So you can imagine that incorrectly grouping the failure modes can have a large effect on that characterization of a phase.
- Quality Failures are driven by a combination of manufacturing variability and design tolerances.
- Corrective action to improve this type of failure is improving the manufacturing process and adjusting tolerances on key design features.
- Use Life failures are characterized by variability in use and environment in combination with stress margins of the design failure modes.
- To improve use life failures the study of use case and environment will direct design and stress margins.
- Wear-out are characterized as a predictable failure mode that is a design characteristic. It has an average time to fail with a normal/lognormal distribution around it that is driven by a combination of variables from quality, use, and environment.
- To improve use life the design must be changed or a preventive maintenance strategy must will be created.
The brake pad study:
How Brakes work:
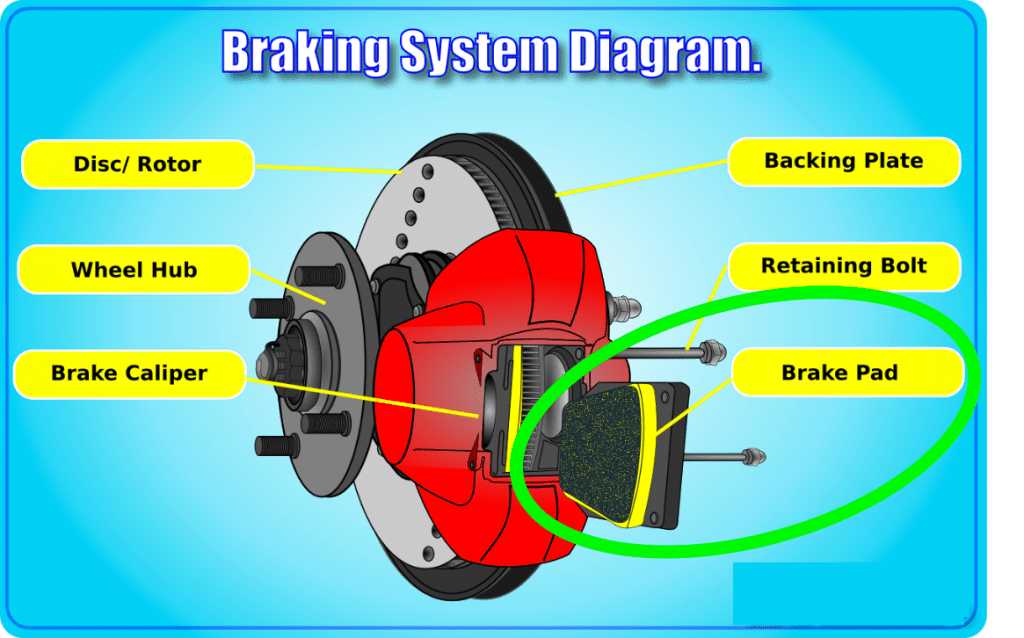
Car brakes are simple. They convert motion to heat. This is done by having a steel disc rotate with your wheel and then  squeezing the disk with a brake pad to create friction. It is the exact same principle as on your bike brakes. You pull the handle and two pads squeeze your wheel rim until enough friction is created to stop the bike. The kinetic energy of the bike was converted to heat on the pads and rim.
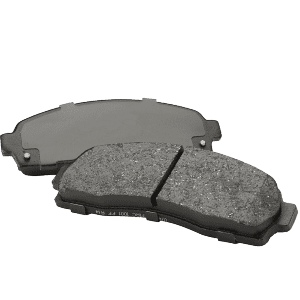
Bicycle brake pads and car brake pads look almost exactly the same. A metal backing plate and a friction material attached together. The bike friction material is usually hard rubber and the car is usually a composite of rubber/glass/metal/ceramic/metal shavings/resin/Swedish Fish (Saab).
Testing has been completed and there is a mountain of data that needs to be transformed into information. These are the types of failures we may have to root cause.
- Shattered brake pad.
- Root cause analysis shows there was a bubble in the center of the brake pad when it was cast. It would be grouped for the analysis data set used in an Infant mortality characterization.
- Cracked brake pad
- Root cause analysis found cause to be a heavy heat load followed by a sudden cooling from driving through a puddle. This is grouped as Use-case variability and would be apart of the use life data set.
- Brake material completely consumed
- Expected result of accumulated stress/use and grouped as a Wear-out data point.
Having the shattered brake pad data points (Infant Mortality) included in the wear-out data set would dramatically shift the wear-out distribution curve into the use life. This would result in a scramble to change the design so the brake pad life can be extended. This is unfortunate because it may be that in fact, the brake pads use life exceeds specifications and this new initiative will add cost, weight, and delay time to release the new product. All while not directing attention to the actual cause of that failure type which is the poor molding of the pads in production.
That is a lot of damage to a product development program from the simple error like poor data grouping.
-Adam
“Test Engineer Consumption”

 Ask a question or send along a comment.
Please login to view and use the contact form.
Leave a Reply