A Systems Reliability Model
Nuclear power stations, nuclear warships and air traffic control centers are renowned amongst industry world-wide for their high-reliability performance. Here is a reliability-based model of how they do it. Your organisation can too.
Keywords: control of human error, failure prevention, defect elimination, accuracy-controlled enterprise, error-proofing
My brother-in-law, who worked for Japan Airlines (JAL) at the time, tells a story of watching Japanese aircraft maintenance technicians overhaul a JAL airplane jet engine. He tells this story because it is so unusual. During his visit to the maintenance hanger he was enthralled by the extraordinary maintenance procedure that the JAL technicians followed.
He watched as a man on a podium, which was in-front of a jet engine being worked-on, read from a manual. Once he’d finished speaking, the technicians at the engine began working on the equipment. The man on the podium went and looked carefully at the work being done. When the technicians finished they stepped away from their work and the man, who seemed to be the supervisor, tested and checked their workmanship. As he went through the double-checking process he would, from time to time, sign a form that he carried. Once his inspection was completed, and the technicians had also signed-off on their work, he returned to the podium and read the next instruction from the manual. The whole process was repeated while my brother-in-law watched in astonishment.
What my brother-in-law saw was Japan Air Lines stringent policy of rebuilding their jet engines by following Standard Operating Procedures paralleled to verbal instruction and supervisory monitoring. The expert supervisor read each task-step, he explained it and then monitored the also fully-qualified and experienced aircraft technicians do the task. As the technicians performed the work the supervisor watched and checked their workmanship. The task was only completed when the technicians and the supervisor confirmed that it had met the required standard and a record of proof was made of its successful completion. Then the next task-step of the job was performed in the same way. By this method Japan Air Lines absolutely ensured its jet engines were correctly rebuilt and fully meet specification.
If you fly Japan Air Lines, it is reassuring to know the rigors that their aircraft mechanics go through to ensure their jet engines and planes are in top order.
In an often-quoted article by human error researcher, James Reason, ‘Human Error: models and management’1, he justly elevates high-reliability organisations, such as nuclear warships, nuclear power plants and air traffic control centers, to be the model of human error control for all industries worldwide to achieve. In these organisations ‘human variability’ is accepted, and work processes are designed to systematically “reconfigure themselves to suit local circumstances” by its peoples’ altering their patterns of behaviour to match the risk involved with a situation. These organisations expect that at crucial times the situational expert automatically becomes the leader. During a nuclear reactor incident, it is the able seamen trained in running the power plant who come together and take the lead in handling the emergency, while the ship’s Captain becomes subservient. In a plane-landing emergency the air traffic controllers’ act to support their compatriot in the dire situation, watching along with him for the unknown, taking-on his other low-priority work so full attention can be paid to the emergency, and providing guidance and assistance all the time. The culture of these organisations encourages people to cooperate in times of threatening danger and high peril. This common expectation that tough situations will be handled by people paralleling into expert-group behaviour acts to insulate the organisation from “more than their fair share of adverse events”. Why are human-dependent processes so fraught with problems that we elevate those organisations suffering fewest problems to mighty heights of respect?
The Problem with Series Processes
Every job is a series process of tasks and activities. Every machine is a series process of parts and assemblies. Every production and manufacturing plant is a series process of interconnected machines. Every company consists of series processes of people, equipment and business systems. Every purchase made from a department store or supermarket is the culmination of a series process of producers, manufacturers and distributors – the supply chain. The problem with series processes is that that are inherently weak to variability. They are unforgiving of error. In a series process one error can snowball and become the iceberg that shipwrecks businesses, takes lives, and destroys machines.
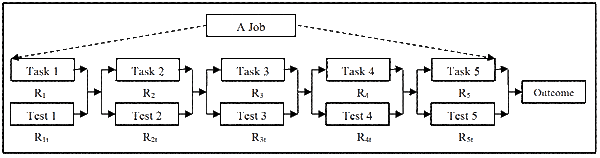
A series process is depicted in Figure 1; in this case it is a simple job that consists of five sequential tasks. But it could just as easily have depicted five machines in a production line, or five companies in a supply chain, or five people working in an organizational process; any organisational process.
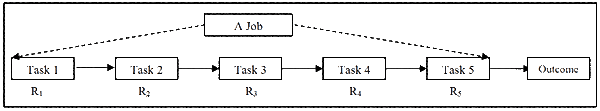
The underscore below the ‘R’ acts to differentiate the modeling of human reliability from component or system reliability. Component and system reliability is seen as probabilistic, giving the connotation of uncontrollable chance. But with human-dependent processes the use of the word ‘reliability’ has the connotation of events being time and situation dependent that are under controllable influences. Probability does not offer the right association when applied to human behaviour, as it does not reflect the adjustability of human performance by method, training and experience.
The inherent weakness of the series arrangement becomes evident when we investigate it using series systems reliability math. The reliability of the five-step process is calculated using Equation 1.
Rjob = R1 x R2 x R3 x R4 x R5 Eq. 1
As an example of using the equation let us say each task contains the chance that it could be done to varying degrees of quality. A task always done perfectly right is 100% reliable, and one always done totally wrong is 0% reliable. In this case ‘task reliability’ is the chance that the task will be done 100% right every time it is done. In our example, say Task 3 has 60% chance of being done correctly, while the remaining four steps are always done perfectly right. The reliability of the series tasks, i.e. the job, would be:
Rjob = 1 x 1 x 0.6 x 1 x 1 = 0.6 (or 60%)
The chance of the whole job being done right is no more than the worst performed task. If every task had 90% adequacy, the reliability of the whole job would be:
Rjob = 0.9 x 0.9 x 0.9 x 0.9 x 0.9 = 0.59 (or 59%)
Even at 90% reliability for each task, the chance that the whole job will be done right is a not very good 59%. It is clear that the job can only be done perfectly if every task is done 100% properly. Here then is the reason for so many of the operating problems in our plant and equipment. In a series process, if one step is wrong, the whole is wrong; if one step is poor, the whole is poor. And this applies to every production process, machine, company, supply chain and job.
All of our operating and maintenance work consists of tasks done in series processes, most of them far longer than the 5-step process of our example with correspondingly greater increased frequency of error. Unless every operating and maintenance task is done perfectly correct, the whole job is never done right, and as a consequence, our plants, production processes and businesses always suffer premature equipment failures.
The Ever-Present and Clear Danger of Human Error
Failure cause data collected from USA nuclear power plants show that human error (from lack of knowledge, misunderstanding, oversight, etc) coupled with poor work processes cause at least 78% of operating plant early-life failures in USA nuclear power plants and at least 72% of such failures in mature nuclear power plants2. By implication these research results reflect across all industries using plant and equipment. It is human error permitted by bad work process design that makes our series arranged processes so unreliable. Human error introduces variability and defects, and unless corrected and controlled by the work process, errors can compound (i.e. ‘snowballs become icebergs’), causing all our work, all our production and all our business processes to be unreliable, to a lesser or greater extent.
Let us see the effect of using real human error rates in our 5-task job. A short list of human error rates applicable to ‘typical’ maintenance and/or plant operating functions is listed in Table I3.
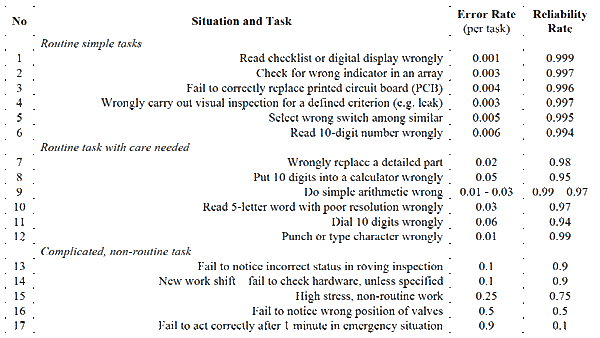
Routine simple inspection and observation tasks incur 100 times fewer errors than complicated work done non-routinely. Maintenance tasks belong to the ‘complicated, non-routine’ category since they are done irregularly and usually jobs are alternated across several crew members in the questionable thinking that if one person is off-work, then another person is available who knows what to do. The high error rates for maintenance and operating tasks make series work processes very risky for equipment reliability and production plant wellness.
What happens to maintenance job reliability if the stress level is high? Such as if the maintainer is put under unrealistic time pressure, or has the incorrect tools and parts to do the job properly, or their safety is compromised. By using the series reliability Equation 1, and factoring the 0.25 error rate of situation 15 from Table I, for a task done under stress, the 5-task job has from 49%, if stress only affects one task , to as little as 24%, chance of being done right if stress affects all tasks.
Rjob = 0.75 x 0.9 x 0.9 x 0.9 x 0.9 = 0.492 (or 49%)
Rjob = 0.75 x 0.75 x 0.75 x 0.75 x 0.75 = 0.237 (or 24%)
And if the 5-task job is done one minute into an emergency (situation 17 of Table I), there could be as little as 6.6% chance, to one-thousandth of one percent chance, of the job being done right.
Rjob = 0.1 x 0.9 x 0.9 x 0.9 x 0.9 = 0.0656 (or 6.6%)
Rjob = 0.1 x 0.1 x 0.1 x 0.1 x 0.1 = 0.00001 (or 0.001%)
Is it any wonder that so many companies across the world suffer from poor performing operations due to equipment failures when maintenance crews and operators go about doing their work using failure-prone series work processes!
The Total Control of Human Error with Error-Preventing Work Processes
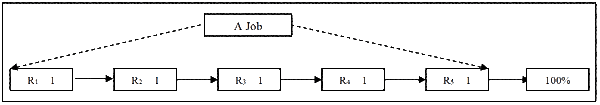
Fortunately, reliability principles also give us the answer to the problems with series processes – the parallel process. A parallel arrangement is shown in Figure 2.
The reliability equation for a parallel arrangement is calculated with Equation 2.
Rpara = 1 – [(1-R1) x (1-R2) x ….(1-Rn)] Eq. 2
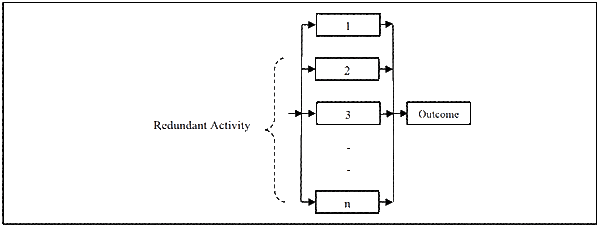
Reliability behaviour is vastly different in a parallel work process. If we take a parallel process of four activities (with three of them being redundant) each having a poor 60% reliability, the reliability of the whole process is:
R = 1 – [(1-0.6) x (1-0.6) x (1-0.6) x (1-0.6)]
= 1 – [(0.4) x (0.4) x (0.4) x (0.4)] = 1 – [0.0256]
= 0.9744 (i.e. 97.4%)
The example shows that a parallel work process arrangement produces high reliability, even from work with a high 40% chance of error. We can use this fact to redesign our work processes to deliver what ever reliability we want from them; so providing total control over human error.
Figure 3 shows the 5-task series process in Figure I as a paralleled 5-task process. To each task a parallel proof-test activity is added to confirm the task is done correctly. Much like the carpenters’ creed ‘measure twice, cut once’.
If we retain the 0.9 reliability of maintenance work for each task, and for the inspect-and-measure proof-test increase it to 0.99 (Table I shows that inspections for defined criteria are 100 time less error prone than non-routine tasks), then each parallel-tested step has a reliability of:
Rtask = 1 – [(1- R1) x (1- R1t)]
= 1 – [(1-0.9) x (1-0.99)] = 1 – [(0.1) x (0.01)] = 1 – [0.001]
= 0.999 (99.9%)
By combining a task with a measurement test activity to prove that the task is done right we create a high-reliability paralleled-task. If proof test activities are added to all tasks it creates a high-reliability work process. This is shown in the example following. The reliability of the entire job of five tasks is now:
Rjob = 0.999 x 0.999 x 0.999 x 0.999 x 0.9999 = 0.995 (i.e. 99.5%)
Paralleling a proof-test to each task drives the reliability for the entire job to its highest level yet. But even 99.5% reliability means that 5 times out of every 1000 opportunities, the job will be done wrong or poorly. In a large, busy operation comprising many people, one thousand opportunities for error accrue rapidly. We need job reliabilities of far greater certainty if we want to drive human error from our work.
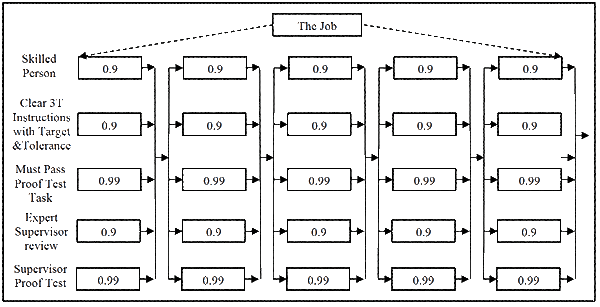
This is achieved by continuing the paralleling activity with each task. It is what the Japan Airlines maintenance crew did on the jet engine in my brother-in-law’s story. By reading the task and explaining it so that it was clearly understood, by using well-trained and skilled technicians, monitored by an expert supervisor, and using proof-test methods to check each task, JAL created a fantastically reliable work process. This is modeled in Figure 4. The test, which involves inspection and/or measurement, takes a reliability of 0.99, while the 0.9 reliability is retained for each of the other paralleled activities. (In reality the high skill levels of the technicians and supervisor raise their workmanship reliabilities well above 0.9. But we will assume that our JAL maintenance technicians are ‘typical’ maintainers.)
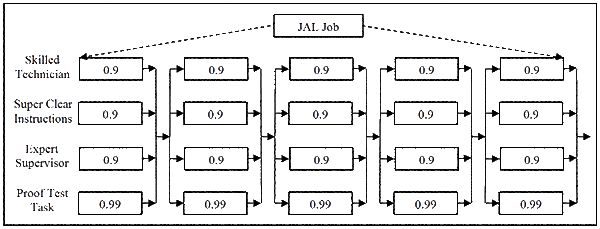
The reliability equation for a JAL paralleled work tasks is shown below.
Rtask = 1 – [(1-0.9) x (1-0.9) x (1-0.9) x (1-0.99)]
= 1 – [(0.1) x (0.1) x (0.1) x (0.01)]
= 0.99999 (i.e. 99.999%, or 1 error per 100,000 opportunities)
The reliability of the entire job of five tasks with each task paralleled in error-preventing configuration is:
Rjob = 0.99999 x 0.99999 x 0.99999 x 0.99999 x 0.99999 = 0.99995 (i.e. 99.995%)
The error rate for the whole job is now 5 errors per 100,000 opportunities. This is the way to drastically reduce human error and get outstandingly reliable craftsmanship in every job.
Defect Elimination and Failure Prevention with 3T – Target, Tolerance Test – Procedures
To make high-reliability workmanship standard practice it must be built into the performance of the work. It must become part of the system of working; it must become ‘the way we do things around here’. Just like the JAL maintenance crew, the activity of doing the work must ensure that high-reliability is the natural outcome, and it is not left to people to decide when a thing is ‘good enough’. Just like the air controllers in an emergency who automatically parallel their expertise together to prevent disaster, we must parallel all tasks done in a job with very specific and certain error-preventing practices.
A simple method to automatically build-in high quality performance is to include the 3Ts – Target, Tolerance, Test – in all standard operating procedure (SOP) tasks for a job that people are trained to do correctly. Within each task is included the standard to be meet and the test that must be passed before the task is accepted as correct.
Figure 5 shows a new way of writing and laying out SOPs to include a clear performance standard, i.e. the ‘target’, that must be met in each task, a clear indication of what is an acceptable outcome for the task, i.e. the ‘tolerance’, and a clear and accurate means to prove the task is done right, i.e. the ‘test’ that must be passed before a task is accepted as being properly done. Figure 5 contains extracts from a procedure covering the replacement of gaskets in pipe flanges. The one rule to follow with a 3T procedure is – ‘do the next task only when the current task is proven to be up to standard’.
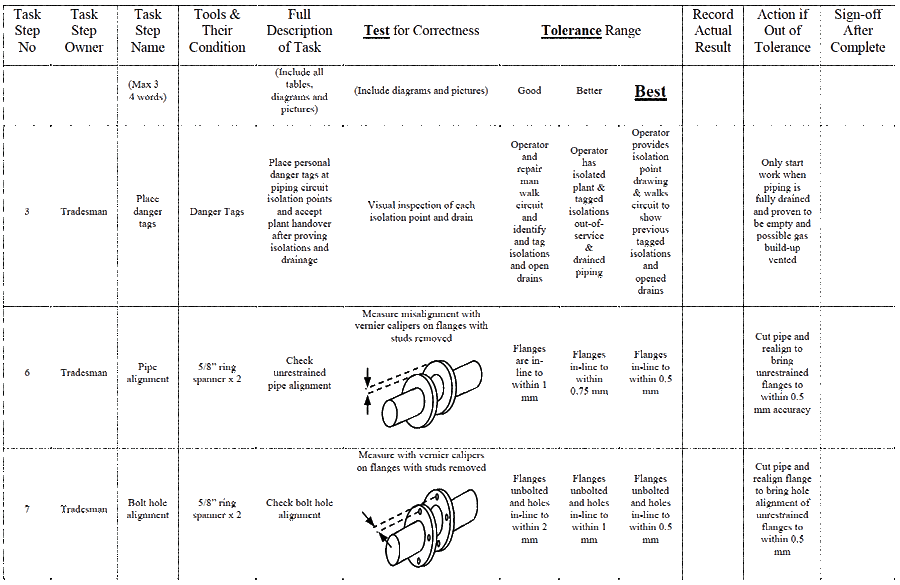
A well-written, clearly described and image-full 3T SOP format provides a clear target to hit, the acceptable tolerance and a proof-test that must be passed before starting the next task. In this way you build the very sound and highly reliable work process shown in Figure 6.
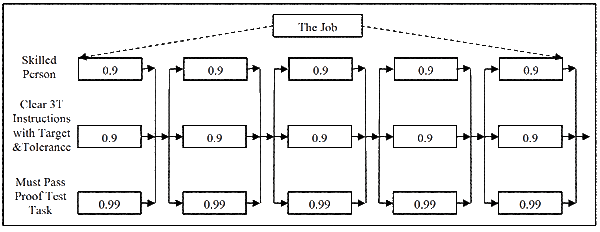
The reliability of each 3T error-preventing step is now:
Rtask = 1 – [(1-0.9) x (1-0.9) x (1-0.99)]
= 1 – [(0.1) x (0.1) x (0.01)]
= 0.9999 (i.e. 99.99%, or 1 error per 10,000 opportunities)
The reliability of the entire job of five 3T tasks is now:
Rjob = 0.9999 x 0.9999 x 0.9999 x 0.9999 x 0.9999 = 0.9995
(i.e. 99.95% or 5 error per 10,000 opportunities)
Should this level of job reliability not be sufficient, then continue paralleling the tasks for more certainty, as in Figure 7.
The reliability of each paralleled error preventing step is now:
Rtask = 1 – [(1-0.9) x (1-0.9) x (1-0.99) x (1-0.9) x (1-0.99)]
= 1 – [(0.1) x (0.1) x (0.01) x (0.1) x (0.01)]]
= 0.999999 (i.e. 99.9999%, or 1 error per 1,000,000 opportunities)
The reliability of the entire job of five super-sure tasks is:
Rjob = 0.999999 x 0.999999 x 0.999999 x 0.999999 x 0.999999 = 0.999995
(i.e. 99.9995% or 5 error per 1,000,000 opportunities)
Should this level of job reliability not be sufficient, then continue paralleling the tasks with more tests for certainty.
The 3Ts SOP format brings to an operation outstandingly reliable workmanship, and allows total control of human error to any level desired.
The Best Answer is ‘Error Proofing’
There is at least one better way to totally control human error than with the 3Ts, and that is to ensure an error cannot happen. If error cannot happen, then paralleling tasks with extra error-prevention activities is unnecessary. In Figure 8 our 5-task job is designed so that it cannot be done wrongly. Examples include changing designs of parts so they can only be assembled one way, and providing parts with tell-tale indication of correct positioning. With machines designed in a form where each maintenance and operating task is completely error-proofed, there can be no mistakes.
The reliability of the five error-proofed-task job is now:
Rjob = 1 x 1 x 1 x 1 x 1 = 1 (or 100% reliability)
We get perfect 100% reliability in an error-proofed series process in all situations and in all circumstances because no task can be done wrongly.
Removing Bad Work Processes throughout the Life Cycle
So far, this paper has covered operator and maintainer error permitted by badly designed operating plant work processes. But of course, human error can occur everywhere, at any time, and in all situations throughout the life cycle of a business. Human error occurs in the feasibility and detailed design phases, the procurement phase, during installation, during commissioning and, as discussed previously, during operation. There are numerous documented investigations into safety incidents confirming that human error occurs at every stage of industrial facility life cycle4.
Figure 9 shows the typical life cycle of a facility. It is obvious that the life cycle is also a series process and the reliability of the operating phase is totally dependant on the reliability of all the numerous human-dependant activities performed beforehand.
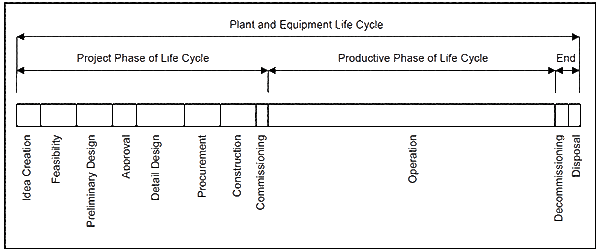
There are multitudes of interconnected series work processes performed during the project phase of a business, providing innumerable opportunities for error. You should by now not be surprised to learn that a great number of them become latent problems that play-out over time to cause equipment failures. This is why you will regularly hear maintainers cursing equipment and production plant designers for their hidden design ‘traps’.
The protection offered by the 3Ts – Target, Tolerance, Test – applies to all human-dependant activity, from Boardroom to the shopfloor, at every level and in every job done in a company. They act to proactively eliminate human error by building incredibly robust and certain work processes. Throughout the life cycle the 3Ts ensure that every task is focused on hitting a clearly-defined, specific target; that each task is tested and proven to be up to ‘standard’ before it is accepted; and if not, it is corrected before progressing further. With the use of parallel-tested tasks, human error is controllable to any level of risk, at every stage and in every activity of a business’ life. Paralleling our tasks with proof-tests means that we can all be top-class experts in all we do.
Bibliography
1. Reason, James, Human Error: models and management, BMJ Volume 320, 18 March 2000
2. Barringer, Paul H., ‘Use Crow AMSSA Reliability Growth Plots to Forecast Future System Failures’, Barringer & Associates, November 2006
3. Smith, Dr, David J., Reliability, Maintainability and Risk, Seventh Edition, Appendix 6. Elsevier, 2005
4. Foord, A. G., Gulland, . G., ‘Can Technology Eliminate Human Error?’, Trans IChemE, Part B, Process safety and Environmental Protection, 2006 84(B3): 171-173

Leave a Reply