Accendo Reliability

Your Reliability Engineering Professional Development Site

  • Home
  • About
    • Contributors
  • Reliability.fm
    • Speaking Of Reliability
    • Rooted in Reliability: The Plant Performance Podcast
    • Quality during Design
    • Critical Talks
    • Dare to Know
    • Maintenance Disrupted
    • Metal Conversations
    • The Leadership Connection
    • Practical Reliability Podcast
    • Reliability Matters
    • Reliability it Matters
    • Maintenance Mavericks Podcast
    • Women in Maintenance
    • Accendo Reliability Webinar Series
    • Asset Reliability @ Work
  • Articles
    • CRE Preparation Notes
    • on Leadership & Career
      • Advanced Engineering Culture
      • Engineering Leadership
      • Managing in the 2000s
      • Product Development and Process Improvement
    • on Maintenance Reliability
      • Aasan Asset Management
      • CMMS and Reliability
      • Conscious Asset
      • EAM & CMMS
      • Everyday RCM
      • History of Maintenance Management
      • Life Cycle Asset Management
      • Maintenance and Reliability
      • Maintenance Management
      • Plant Maintenance
      • Process Plant Reliability Engineering
      • ReliabilityXperience
      • RCM Blitz®
      • Rob’s Reliability Project
      • The Intelligent Transformer Blog
    • on Product Reliability
      • Accelerated Reliability
      • Achieving the Benefits of Reliability
      • Apex Ridge
      • Metals Engineering and Product Reliability
      • Musings on Reliability and Maintenance Topics
      • Product Validation
      • Reliability Engineering Insights
      • Reliability in Emerging Technology
    • on Risk & Safety
      • CERM® Risk Insights
      • Equipment Risk and Reliability in Downhole Applications
      • Operational Risk Process Safety
    • on Systems Thinking
      • Communicating with FINESSE
      • The RCA
    • on Tools & Techniques
      • Big Data & Analytics
      • Experimental Design for NPD
      • Innovative Thinking in Reliability and Durability
      • Inside and Beyond HALT
      • Inside FMEA
      • Integral Concepts
      • Learning from Failures
      • Progress in Field Reliability?
      • Reliability Engineering Using Python
      • Reliability Reflections
      • Testing 1 2 3
      • The Manufacturing Academy
  • eBooks
  • Resources
    • Accendo Authors
    • FMEA Resources
    • Feed Forward Publications
    • Openings
    • Books
    • Webinars
    • Journals
    • Higher Education
    • Podcasts
  • Courses
    • 14 Ways to Acquire Reliability Engineering Knowledge
    • Reliability Analysis Methods online course
    • Measurement System Assessment
    • SPC-Process Capability Course
    • Design of Experiments
    • Foundations of RCM online course
    • Quality during Design Journey
    • Reliability Engineering Statistics
    • Quality Engineering Statistics
    • An Introduction to Reliability Engineering
    • An Introduction to Quality Engineering
    • Process Capability Analysis course
    • Root Cause Analysis and the 8D Corrective Action Process course
    • Return on Investment online course
    • CRE Preparation Online Course
    • Quondam Courses
  • Webinars
    • Upcoming Live Events
  • Calendar
    • Call for Papers Listing
    • Upcoming Webinars
    • Webinar Calendar
  • Login
    • Member Home

by Fred Schenkelberg Leave a Comment

Creating a Dot Plot

Creating a Dot Plot

Graphs contain information and often tell a story. Our interpretation of the graphic can be aided or hindered by the design or style of the plot. Cleveland and McGill (1984) studied graphical perception and found the use of dot plots to aid viewers to understand the data’s message clearly.

The nature of a dot plot is like a bar chart, yet without the bars. Less ink, just a dot to indicate count or position along an axis permits conveying information simply. Due to its simplicity, it also permits adding additional information useful for comparisons or spotting trends, and more.

Reading a Dot Plot

Let’s compare a bar chart of returns – similar to a Pareto chart as in this case it is a sorted bar chart.

And, the same data in a dot plot.

The bars add weight and visual clutter compared to the dot plot.

Simple Construction of a Dot Plot

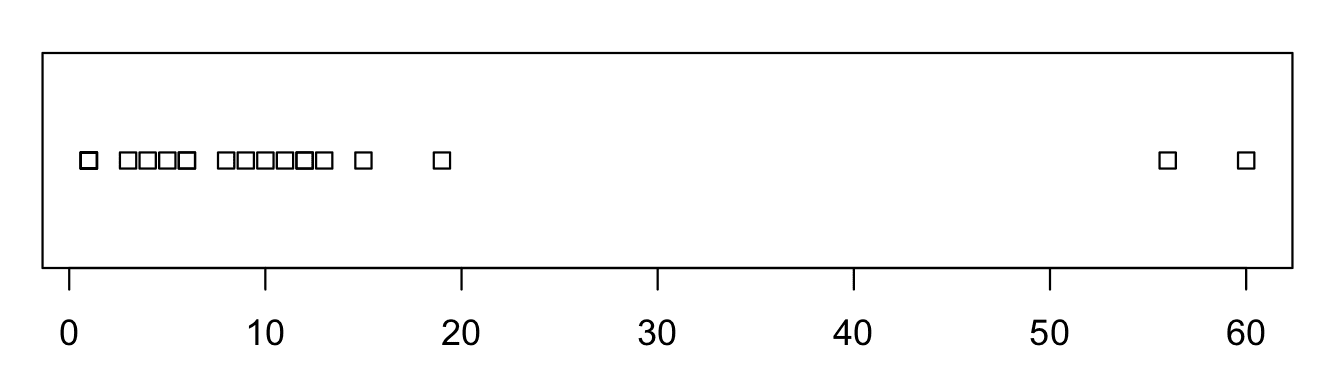
For small datasets, you can build a simple dot plot by hand (or via software) by using a dot for each bit of data. Let’s say we have 10 failure modes we commonly see with field returns. For each unit returned we note which type of failure is present. Zero, here, indicated no problem found.

We simply create a dot for each observation. We have three units with no problems found, and also 3 units with a type 7 failure mode. There were 10 observations in total. This can easily be done by hand when gathering or reviewing data.

Think of the dot plot as a histogram or bar chart that uses a dot to indicate the value instead of a bar. This dot per point of data could also be useful to show a distribution of measurements.

Also, useful to compare to sets of measurements.

Variations and Enhancements

Dot plots can show groupings, comparisons, differences, etc. Here’s an example of grouping created by Robert L. Kabacoff using the R software ‘mtcars’ dataset.

You can find additional examples of more complex, yet very informative dot plots within the post ‘Cleveland Dot Plots’ on the UC Business Analytics R Programing Guide.

Filed Under: Articles, CRE Preparation Notes, Probability and Statistics for Reliability

« Dealing with Reliability Related Uncertainty
What this Gorgeous Tree Taught Me about Periodically Reviewing Proactive Maintenance »

Leave a Reply Cancel reply

Your email address will not be published. Required fields are marked *

CRE Preparation Notes

Article by Fred Schenkelberg

Join Accendo

Join our members-only community for full access to exclusive eBooks, webinars, training, and more.

It’s free and only takes a minute.

Get Full Site Access

Not ready to join?
Stay current on new articles, podcasts, webinars, courses and more added to the Accendo Reliability website each week.
No membership required to subscribe.

  • CRE Preparation Notes
  • CRE Prep
  • Reliability Management
  • Probability and Statistics for Reliability
  • Reliability in Design and Development
  • Reliability Modeling and Predictions
  • Reliability Testing
  • Maintainability and Availability
  • Data Collection and Use

© 2023 FMS Reliability · Privacy Policy · Terms of Service · Cookies Policy

This site uses cookies to give you a better experience, analyze site traffic, and gain insight to products or offers that may interest you. By continuing, you consent to the use of cookies. Learn how we use cookies, how they work, and how to set your browser preferences by reading our Cookies Policy.