Barringer Process Reliability – Your “factory” performance on a single page
Paul H. Barringer invented the Barringer Process Reliability (BPR) process. Paul was a fellow Reliability Engineer “extraordinaire” and an outstanding mentor for myself and countless others in this field of practice. BPR highlights operational issues. If not addressed or mitigated, those could have significant revenue impacts on an operation. A BPR analysis uses the Weibull probability plot which happens to be a very well-known tool in the field of Reliability Engineering. On one side of a sheet of paper only, the BPR plot can tell the true “story” on the operation. One of those “stories” relates to high impact events best tackled by a Root Cause Analysis.
A BPR plot can provide an organization with the following information:
- Production Key Performance Indicators (KPI)
- Benchmarking between similar production units
- Production loss quantification as a result of the poor “factory” performance.
This article deals with the latter; the loss quantification. There are two main buckets for those losses.
- Reliability losses also know as “Crash and Burn” losses. These are generally physical losses including asset or equipment failures as well as unplanned plant shutdowns
- Efficiency and Utilization (E&U) losses. These are more “subtle” yet significant losses based on the under utilization of the facility. Such as bottle necks or waste.
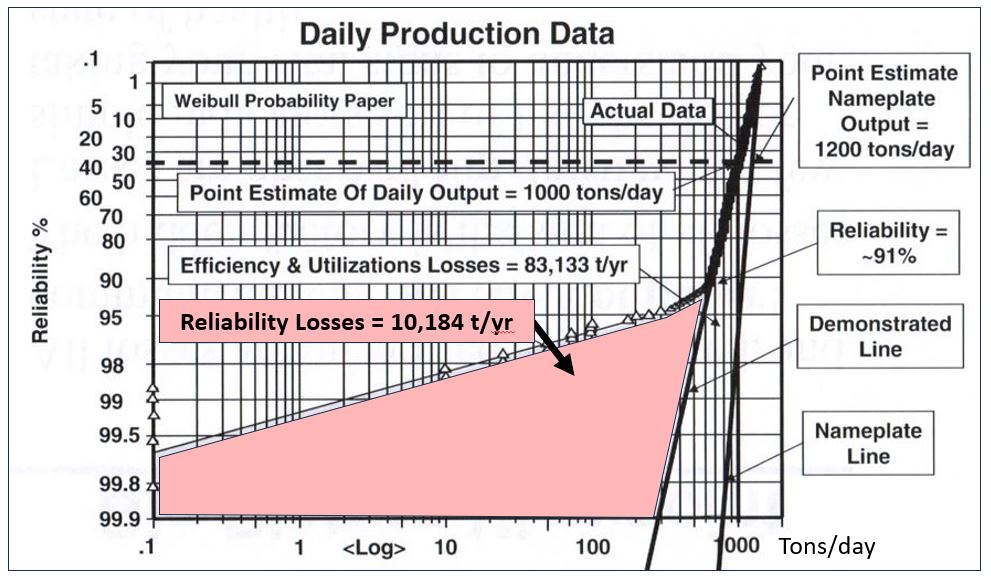
Diagram 1 below illustrates those losses in a BPR plot. A graphical integration helps calculate those losses. For example, the integration of the pink section in Diagram 1 will provide us with the total Reliability losses.

Root Cause Analysis overview
Root Cause Analysis (RCA) is a structured approach to identifying the underlying factors that result in the unwanted/unexpected outcomes of chronic or sporadic events. It is a methodic and rigorous process. It also highlights what assets, systems or behaviors need to be modified in order to limit or eliminate recurrence of similar outcomes. The fundamental driver is to address, correct or mitigate the root causes that lead to the unwanted event rather than addressing the symptoms. Bob Latino, a renowned RCA expert, summarizes this concept as “the establishing of logically complete, evidence based, tightly-coupled chains of factors from the least acceptable consequences to the deepest significant underlying causes.”
RCAs are extremely informative and value-added exercises. They can stand out as “learning moments” for an entire organization. But their depth causes them to be work intensive. Due to limited resources in every organization, the initiation of an RCA has to be carefully evaluated and prioritized. Typically, an RCA process would include a prioritization method which defines the risk threshold triggering the RCA. An example is provided in Table 1 below.

The above suggests that RCAs should be governed by rigorous, established, and well understood processes and procedures.
Using BPR to assess the potential benefits of conducting RCAs
BPR is a 10,000 foot or “bird’s eye” strategic overview of the operation. It does not highlight what is specifically causing production losses. As a general rule, the process informs the operation by how much it is broken rather than what is broken. It relates to the “how much” versus the “why” or the “how”. The latter “how” and “why” is exactly what an RCA does. Managers do not need to go into details so BPR is the perfect tool to develop a vision on how to manage RCAs. Managers will assign the “why” and “how” to their subordinates for solutions. Diagram 2 below illustrates an example where the Reliability losses amount to 10,184 tons per year. If 1 ton of ore generates a revenue of 100 dollars, the recovery of those losses could return approximately 1 million dollars per year.

When high impact events or significant chronic events occur, they should be addressed by the organization based on the RCA processes and thresholds as defined in Table 1 above. This is essentially doing RCAs as needed. As an alternative, BPR helps with quantifying the whole picture. In other words:
- How much benefit can the organization get from conducting RCAs?
- Or, how much of the losses can RCAs help the organization recover?
BPR summarizes the total amount of losses in each of the 2 categories i.e. Reliability versus Efficiency and Utilization losses. Efficiency and Utilization losses require a Six Sigma approach. According to Paul Barringer, using Six Sigma, it is harder to achieve results compared to RCAs. Six Sigma focuses on control and reducing variations in the data. Whereas RCAs tackle obvious outliers. That is why when addressing BPR losses, it is recommended to start tackling Reliability losses, essentially the “low hanging fruit”.
In summary, using BPR techniques, one can estimate the total “prize” recoverable using RCAs. As such, the company can justify investing in the resources required to conduct those exercises.
 Ask a question or send along a comment.
Please login to view and use the contact form.
Leave a Reply