Accendo Reliability

Your Reliability Engineering Professional Development Site

  • Home
  • About
    • Contributors
  • Reliability.fm
    • Speaking Of Reliability
    • Rooted in Reliability: The Plant Performance Podcast
    • Quality during Design
    • Critical Talks
    • Dare to Know
    • Maintenance Disrupted
    • Metal Conversations
    • The Leadership Connection
    • Practical Reliability Podcast
    • Reliability Matters
    • Reliability it Matters
    • Maintenance Mavericks Podcast
    • Women in Maintenance
    • Accendo Reliability Webinar Series
    • Asset Reliability @ Work
  • Articles
    • CRE Preparation Notes
    • on Leadership & Career
      • Advanced Engineering Culture
      • Engineering Leadership
      • Managing in the 2000s
      • Product Development and Process Improvement
    • on Maintenance Reliability
      • Aasan Asset Management
      • CMMS and Reliability
      • Conscious Asset
      • EAM & CMMS
      • Everyday RCM
      • History of Maintenance Management
      • Life Cycle Asset Management
      • Maintenance and Reliability
      • Maintenance Management
      • Plant Maintenance
      • Process Plant Reliability Engineering
      • ReliabilityXperience
      • RCM Blitz®
      • Rob’s Reliability Project
      • The Intelligent Transformer Blog
    • on Product Reliability
      • Accelerated Reliability
      • Achieving the Benefits of Reliability
      • Apex Ridge
      • Metals Engineering and Product Reliability
      • Musings on Reliability and Maintenance Topics
      • Product Validation
      • Reliability Engineering Insights
      • Reliability in Emerging Technology
    • on Risk & Safety
      • CERM® Risk Insights
      • Equipment Risk and Reliability in Downhole Applications
      • Operational Risk Process Safety
    • on Systems Thinking
      • Communicating with FINESSE
      • The RCA
    • on Tools & Techniques
      • Big Data & Analytics
      • Experimental Design for NPD
      • Innovative Thinking in Reliability and Durability
      • Inside and Beyond HALT
      • Inside FMEA
      • Integral Concepts
      • Learning from Failures
      • Progress in Field Reliability?
      • Reliability Engineering Using Python
      • Reliability Reflections
      • Testing 1 2 3
      • The Manufacturing Academy
  • eBooks
    • Reliability Engineering Management DRAFT
  • Resources
    • Accendo Authors
    • FMEA Resources
    • Feed Forward Publications
    • Openings
    • Books
    • Webinars
    • Journals
    • Higher Education
    • Podcasts
  • Courses
    • 14 Ways to Acquire Reliability Engineering Knowledge
    • Reliability Analysis Methods online course
    • Measurement System Assessment
    • SPC-Process Capability Course
    • Design of Experiments
    • Foundations of RCM online course
    • Quality during Design Journey
    • Reliability Engineering Statistics
    • An Introduction to Reliability Engineering
    • An Introduction to Quality Engineering
    • Process Capability Analysis course
    • Root Cause Analysis and the 8D Corrective Action Process course
    • Return on Investment online course
    • CRE Preparation Online Course
    • Quondam Courses
  • Webinars
    • Upcoming Live Events
  • Calendar
    • Call for Papers Listing
    • Upcoming Webinars
    • Webinar Calendar
  • Login
    • Member Home

by Fred Schenkelberg 2 Comments

Mann-Whitney U Test

Mann-Whitney U Test

The U test permits the comparison of two samples to determine if they came from the same population or not. This non-parametric test can use ordinal data, meaning it is in some rank order without containing information about relative distances between ranks.

For example, if we ask people to score brand preference on a 5 point scale, we could compare brands. Or we can compare time to failure information, as it is rarely normally distributed.

Of course, we can use continuous data, such as lifetime, cycles, time, or distance when the underlying data is not normally distributed or expected to be normally distributed. The U test is useful when the t-test is not appropriate to determine if two medians are equivalent or not. Recall the t-test assumes the population involved in the test has a normal distribution.


Two hypotheses

The null hypothesis, Ho, for a U test is the two samples have been drawn from the same population or populations with the same shape and spread (not necessarily normal).

The alternative hypothesis, Ha, may be one or two sided. One sides alternatives is one sample comes from a larger or smaller population than the other sample. A two-sided alternative evaluates if there is convincing information to say the two samples are from different populations or not.

We use the data from the two samples and arrange them together in an increasing rank order. Then we count the number of times that a rank value from one group precedes a rank score in the other group. An example may illustrate this simple process clearly.

U-test Example

Let’s say we have two types of pumps and we want to determine is one is longer lasting than the other. We have been using both types of pumps in the plant for a few years and have complete time to failure data (time from installation to failure). In this simple example all of the pumps from both brands have failed (loss of pressure, leaking, excessive current draw, or however we want to define failure).

Brand X had five units and they had the following time to failure in months: 3, 4, 2, 6, and 2.

Brand Y had six units and they have the following time to failures in months: 4, 7, 5,10, 6, and 8.

It appears that Brand Y is lasting longer and we want to determine if the data provides statistically significant support for this hypothesis.

The life data is most likely not normally distributed so we are using the non-parametric Mann-Whitney U test for the evaluation.

Step 1 – Set up the hypothesis test

The null hypothesis is that the two pumps behave the same. Ho: X = Y

The alternative hypothesis is pump from Brand Y last longer. Ha: Y > X

Step 2 – Rank order all the data

BrandLife (months)Rank
X21.5
X21.5
X33
X44.5
Y44.5
Y56
X67.5
Y67.5
Y78
Y89
Y1010

Note that ties have ranked the average of ranking. For example, the two 6 month lifetimes are ranked 5.5 which is (5 + 6) / 2.

Step 3 – Add up ranks for two samples

For Brand X, T1 = 1.5 + 1.5 + 3 + 4.5 + 7.5 = 18

For Brand Y, T2 = 3.5 + 6 + 7.5 + 8 + 9 + 10 = 44

Step 4 – Select the larger rank

In this case, it is T2, which we use later as Tx to designate the larger rank total.

Step 5 – Calculate counts

The number of units in each group.

Brand X has 5 units thus n1 = 5.

Brand Y has 6 units thus n2 = 6.

The larger rank total group is Brand Y thus nx = 6.

Step 6 – Find U

$$ \large\displaystyle \begin{array}{l}U=n1\times n2+nx\times \frac{\left( nx+1 \right)}{2}-Tx\\U=5\times 6+6\times \frac{\left( 6+1 \right)}{2}-44\\U=7\end{array}$$


Step 7 – Find the critical value

Let’s use a 5% significance and a lookup table for critical values for a U test.

Critical Values of U 5 percent

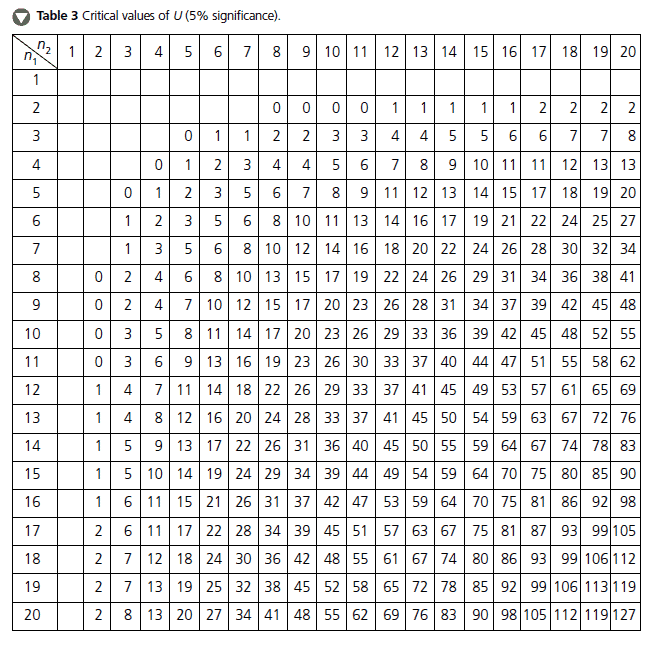
table from: http://www.snabonline.com/Content/SkillsSupport/MathsAndStatsSupport/M0_14S.pdf

n1 = 5 and n2 = 6, we find the critical value at the intersection with a value of 3.

Step 8 – Compare test statistic to critical value

For a U test if the calculated U-value is equal to or less than the critical value we have evidence that the alternate hypothesis is true with significance.

In this case, the calculated U (test statistic) is 7 and the critical value is 3, thus there is not sufficient evidence that the Brand Y pumps last longer (median lifetime) than the Brand X pumps with 5% significance.


Related:

Paired-Comparison Hypothesis Tests (article)

Kruskal-Wallis Test (article)

Hypothesis Test Selection (article)

Filed Under: Articles, CRE Preparation Notes, Probability and Statistics for Reliability Tagged With: Non-parametric statistical methods

« Networked and Positive as a Reliability Engineer
Successful Reliability Engineers Add Value »

Comments

  1. Yvette says

    August 25, 2016 at 8:35 AM

    Hi! Thanks for the well-explained steps. Can I know when this information was published?

    Thanks
    Yvette

    Reply
    • Fred Schenkelberg says

      August 31, 2016 at 9:32 AM

      Sure, April 6th, 2014

      Cheers,

      Fred

      Reply

Leave a Reply Cancel reply

Your email address will not be published. Required fields are marked *

CRE Preparation Notes

Article by Fred Schenkelberg

Join Accendo

Join our members-only community for full access to exclusive eBooks, webinars, training, and more.

It’s free and only takes a minute.

Get Full Site Access

Not ready to join?
Stay current on new articles, podcasts, webinars, courses and more added to the Accendo Reliability website each week.
No membership required to subscribe.

  • CRE Preparation Notes
  • CRE Prep
  • Reliability Management
  • Probability and Statistics for Reliability
  • Reliability in Design and Development
  • Reliability Modeling and Predictions
  • Reliability Testing
  • Maintainability and Availability
  • Data Collection and Use

© 2023 FMS Reliability · Privacy Policy · Terms of Service · Cookies Policy

This site uses cookies to give you a better experience, analyze site traffic, and gain insight to products or offers that may interest you. By continuing, you consent to the use of cookies. Learn how we use cookies, how they work, and how to set your browser preferences by reading our Cookies Policy.