Measuring Manufacturing Effectiveness – Chapter 2: Manufacturing Time as a System
Over the past several years, I’ve been discovering a structured framework for understanding and improving how manufacturing organizations define, measure, and interpret “effectiveness.”
Not efficiency. Not productivity in isolation. Not isolated KPIs. But manufacturing effectiveness as a system that integrates operations, quality, reliability, capacity, flow, decision-making, and management behavior into a coherent measurement model. It may sound like a lofty goal. But please stay with me.
This article is drawn from Chapter 2 of my book, Measuring Manufacturing Effectiveness, which focuses on understanding time as a resource that is systematically reduced by cumulative and irreversible losses, at the end of which remains the time needed to manufacture good parts.
Rather than presenting disconnected metrics or abstract theory, this chapter is designed to help practitioners think more clearly about:
- What we actually mean by “effectiveness” in manufacturing
- Why common measurement approaches fail
- How misaligned metrics distort decision-making
- How systems-level thinking changes measurement design
The following is Measuring Time as a System; the complete 2nd chapter as found in the book.
Chapter 2: Manufacturing Time as a System
Manufacturing effectiveness is ultimately a question of how time is converted into usable output. All other measures including parts produced, cost incurred, and revenue generated are downstream of time allocation and loss.
This chapter treats manufacturing time as a system of progressive reduction, rather than a static quantity.
Time as a Finite Resource
Calendar time is fixed. It advances continuously, regardless of demand, staffing, or production intent.
Within that fixed window, organizations choose how much time to allocate to production and how much to reserve for non-production activities. From that point forward, system behavior determines how much of the allocated time produces usable output.
Time is therefore both a strategic and operational resource.
From Calendar Time to Output
Manufacturing time is not consumed all at once. It is reduced in stages.
At each stage, a portion of time is lost due to either deliberate choice or system behavior. The remaining time is passed downstream.
This progressive reduction is not reversible. Time lost at an upstream stage cannot be recovered through downstream efficiency. Figure 1 illustrates this structure.
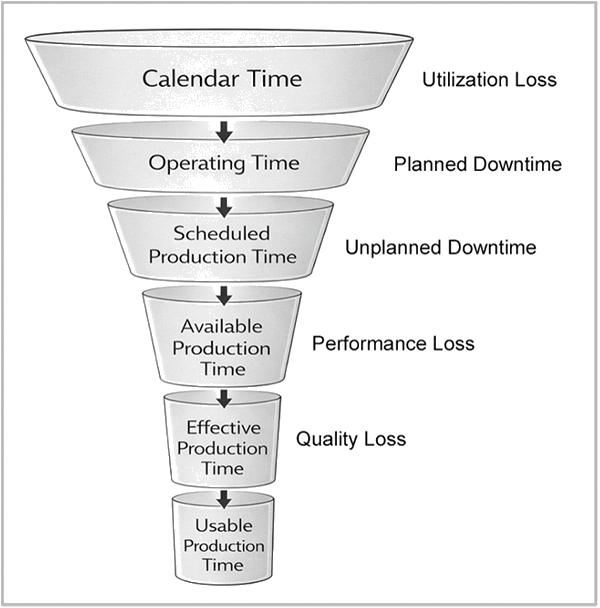
reduced through utilization decisions and successive loss mechanisms to
yield usable production time.
The Time Funnel Concept
The manufacturing time funnel shown in Figure 1 represents time as a sequence of filters rather than a single pool.
At a high level:
- Calendar time is reduced by utilization decisions
- Operating time is reduced by planned downtime
- Scheduled production time is reduced by unplanned downtime
- Available production time is reduced by performance loss
- Effective production time is reduced by quality loss
What remains is good output time.
Each reduction corresponds to a different class of decision or behavior. Treating all lost time as equivalent obscures these distinctions.
Choice Versus Condition
Time losses fall into two broad categories:
- Choice-based losses, which reflect deliberate decisions
- Condition-based losses, which reflect system behavior
Planned downtime and utilization limits are choice-based. Unplanned downtime, performance instability, and quality loss are condition-based. This distinction is essential for interpretation. Improving effectiveness requires different actions depending on the nature of the loss.
Why Aggregation Misleads
Aggregating all lost time into a single metric hides causality.
For instance, two systems may produce the same output while exhibiting very different loss structures. One may be limited by utilization decisions and the other by instability.
Without separating time losses by stage, metrics become descriptive but not diagnostic.
Time-Based Metrics as Views
TEEP, OOE, and OEE are views applied to different segments of the same time funnel. They do not describe different systems.
The denominator defines the scope of time under consideration. The numerator remains usable output.
For example, a machining cell produces 3,600 good parts in one week. That output is the same regardless of how effectiveness is measured. And the time consumed in the production of those 3,600 good parts becomes the numerator in each of the following ratio metrics:
- OEE compares Good Output Time to Scheduled Production Time, the time during which production was expected to run.
- OOE compares it to the planned operating time.
- TEEP compares it to the entire calendar week.
Only the time base changes. The production system does not. Understanding where a metric applies within the funnel is a prerequisite to interpreting its value.
Implications for Measurement
Treating manufacturing time as a system leads to several practical implications:
- Metrics must be interpreted in sequence, not isolation
- Improvement at one stage cannot compensate for losses upstream
- Apparent efficiency may coexist with poor effectiveness
- Recovery behavior influences multiple stages simultaneously
These implications are developed in later chapters.
Role of the Time Funnel in This Book
The time funnel provides the structural backbone for the framework presented in this book.
All subsequent metrics, definitions, and examples are interpretations of this structure. Figures and tables make the reductions explicit. Calculations quantify them.
The funnel itself is not a model to optimize. It is a lens to understand.
Key Takeaways
- Time is the primary resource consumed by manufacturing systems.
- Manufacturing time is reduced progressively with cumulative and irreversible losses.
- Choice-based and condition-based losses require different responses.
- Metrics are views applied to different segments of the same system.
Understanding manufacturing effectiveness begins with understanding how time flows through the system.
This chapter is part of a 12-chapter structured framework developed in my book, Measuring Manufacturing Effectiveness. The book presents a systems-based approach to manufacturing measurement that integrates:
- Operational performance
- Reliability and availability
- Quality performance
- Flow and constraints
- Decision structures
- Management signaling
- KPI architecture
- Strategic coherence
Each chapter builds on the previous one to form a unified model for understanding how measurement systems shape real-world manufacturing behavior and outcomes.
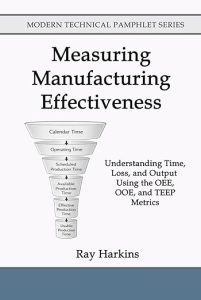
Measuring Manufacturing Effectiveness
Understanding Time, Loss, and Output Using the OEE, OOE, and TEEP Metrics
by Ray Harkins
The book consolidates the complete framework into a single coherent model rather than isolated articles. If you’d like access to the full structured framework, including all chapters, diagrams, models, equations, and supporting examples, the complete book is available in hardcover and Kindle ebook.
Measuring Manufacturing Effectiveness is a concise technical handbook for manufacturing professionals who want to use data and metrics to understand what is really happening on the shop floor.
Most discussions of OEE reduce performance to “running too slow” and treat downtime as a single bucket. Those approaches produce scorekeeping, not insight. This book takes a different route: it shows how manufacturing time is progressively converted into usable output, and how common effectiveness metrics make losses visible when they are interpreted correctly.
Proceeds from the sale of this book support the work of Accendo Reliability.
Ray Harkins is the General Manager of Lexington Technologies in Lexington, North Carolina. He earned his Master of Science from Rochester Institute of Technology and his Master of Business Administration from Youngstown State University. He also teaches 60+ quality, engineering, manufacturing, and business-related courses such as Quality Engineering Statistics, Reliability Engineering Statistics, Failure Modes and Effects Analysis (FMEA), and Root Cause Analysis and the 8D Corrective Action Process through the online learning platform, Udemy.

Leave a Reply