
The Weibull distribution is a highly popular workhorse in Reliability Engineering. Sometimes a little too popular. Its shape parameter (β) provides valuable information on the life characteristics of assets. In practice, a single Weibull distribution often fails to represent field or fleet data because the observed failures are not generated by only one homogeneous population. Instead, the data is frequently a blend of multiple underlying subpopulations. Relating to different designs, suppliers, duty cycles, environments, maintenance histories, etc. This is where multipopulation (mixture) Weibull models become valuable. They explicitly model heterogeneity rather than forcing one curve to “average out” incompatible behaviors. It is therefore incorrect to assume the population of failure times comes from a single Weibull distribution characterized by shape parameter 𝛽 and scale parameter 𝜂.
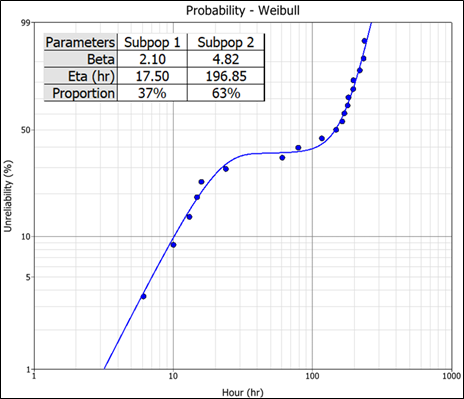
The mixed Weibull distribution1 (also known as a multimodal Weibull) is used to model data that do not fall on a straight line on a Weibull probability plot. As shown in Graph 1 above. Data of this type, particularly if the data points follow an S-shape on the probability plot, may be indicative of more than one failure mode at work in the population of failure times. Field data from a given mixed population may frequently represent multiple failure modes. The necessity of determining the life regions where these failure modes occur is apparent when it is realized that the times-to-failure for each mode may follow a distinct Weibull distribution, thus requiring individual mathematical treatment. Another reason is that each failure mode may require a different design change to improve the component’s reliability.
Mixed Weibulls in the Bath-tub Curve
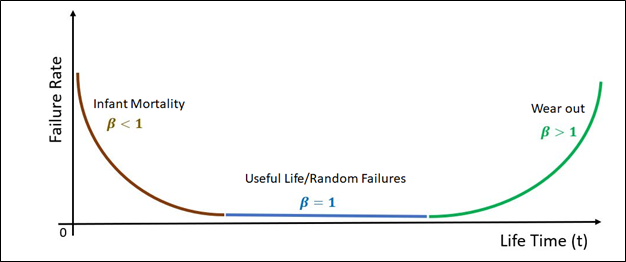
One of the classical examples of mixed or multimodal Weibull is the Bath-tub Curve. The bathtub curve is the classic way reliability engineers visualize how hazard rate changes over an item’s life. It typically starts with high early-life failure rate. This is known as the “infant mortality” section with a shape parameter β<1. This section is driven by latent defects that are manufacturing or installation related.
This is followed by a low, roughly constant hazard region know as the useful life and dominated by random overstress and chance events. In this section, the shape parameter β is close to one.
The last section is a rising hazard region or wear-out as degradation mechanisms (fatigue, corrosion, wear, insulation aging, etc.) accumulate. A useful way to interpret the Bath-tub curve is that it often reflects population heterogeneity. Not a single homogeneous failure mechanism exists. It can be modeled as a mixed-population (mixture) Weibull distribution. Different subpopulations (e.g., weak units vs. robust units, or different failure modes) each follow their own Weibull parameters; the “observed hazard” becomes the weighted combination of these components.
Graph 2 below illustrates the Bath-tub curve in a symmetrical layout. The uniform symmetry is never achieved and is used here for illustration purposes only.
Therefore, when constructing life analysis models in Reliability Engineering, it is important to consider the concept of mixed populations and mixed failure modes.
The mixed Weibull is a true representation of asset life characteristics. The fact that it provides proportions as shown in Graph 1, can help in the decision-making process. For example, if the proportion of infant mortality is high, it would invite the asset operator to conduct a Root Cause Analysis to identify the cause.
(1) Reliasoft Help Portal – The Mixed Weibull Distribution – https://help.reliasoft.com/reference/life_data_analysis/lda/the_mixed_weibull_distribution

Leave a Reply