Process Capability Articles
This post provides a list of my process capability articles, a short description and a link. The goal is to make it easy for the reader to locate any of the articles. It is recommended to read these articles in the order presented. This post will be updated when additional posts are written on the Process Capability topic.
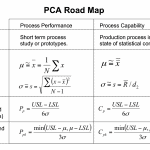
- “Process Capability Analysis I” defines some common indices that are used to measure capability. It discussed the Pp, Ppk, Cp, and Cpk.
- “Process Capability Analysis II” describes how to calculate the fraction of non-conforming items and provides examples.
- “Process Capability Analysis III” showed the connection between the indices and the fraction of non-conforming items.
- “Process Capability Analysis IV” started the discussion of how to improve the process. One way is to identify which manufacturing step is responsible for some type of non-conformance. After the process stage is identified, focused actions to improve the process are possible. A followup article will focus on methods to reduce variation in a process stage. Sometimes the methods are simple maintenance and/or calibration. Other methods involve a systematic study of the effects of changes in factor levels on variation.
- “Process Capability Analysis V” discusses variation reduction to improve process capability. Applying Design of Experiments is suggested as a way to identify which of many production factors could be responsible for variation. A case study of a new aluminum manifold casting was discussed.
- “Process Capability VI” extended process capability analysis to non-normally distributed critical characteristics. The example used was for the Rdson (resistance drain to source while on) of an electronic device. the Rdson is log normally distributed and therefore constrained to be greater than 0 Ohms resistance. Such a device doesn’t need a lower specification limit. Therefore the Cpk calculation needs to consider only the upper specification limit.
- “Process Capability VII” discusses confidences limits, assuming the process is in statistical control and the measured characteristic is normally distributed. The $-P_p-$ index confidence limits can be calculated using the $-\chi^2-$ distribution. But confidence limits for the other indices have not been defined. Feedback from readers is requested.
If anybody wants to engage me on this or other topics, please contact me. I have worked in Quality, Reliability, Applied Statistics, and Data Analytics over 30 years in design engineering and manufacturing. In the university, I taught at the graduate level. I provide Minitab seminars to corporate clients, write articles, and have presented and written papers at SAE, ISSAT, and ASQ. I want to assist you.
Dennis Craggs, Consultant
810-964-1529
dlcraggs@me.com
 Ask a question or send along a comment.
Please login to view and use the contact form.
Leave a Reply