Definition of Reliability
The concept of Reliability is often misused, misunderstood, and misinterpreted. Reliability in its academic root, is defined as the probability that a system will perform its intended function in a specified mission time and within specific process conditions. So, it is in essence a probability.
The ageing variable is crucial in calculating the reliability of a system. Reliability is the Probability of Success. And 1 minus the Probability of Failure. In the equation below , the ageing variable is time (t).
$$ \displaystyle \large R\left(t\right) = 1 – F\left(t\right) \:\:\:\: (where \: F = Failure \: Probability) $$
Reliability engineering is based on building data models to predict future system performance accurately. Based on past performance records. The model is more or less precise depending on how many past records we have. The more data, the more precise the model. At the end of the day, a well defined model, even with a little data, is better than no model. At least we can proceed in the right direction. That is, make the best possible decision for our assets.
This article looks at a non exhaustive list of models in the Reliability Engineering realm.
The Life Analysis Model
Assets typically age when used, leading to degraded performance and loss of function. Asset life models are built in order to predict future degradation patterns. Those models are based on asset degradation variables such as time or usage. Life Analysis involves using past degradation records to build a statistical life model. Those life models take into account the true evolution of the component degradation. Those models are unique to specific equipment whereby each equipment type would have their own life model. The records used come mostly from the Computer Maintenance Management System (CMMS). However, in the absence of a CMMS, other sources or inputs1 can be used.
Below is a short video from my website further explaining the Life Analysis concept.
The RAM Model
The fundamental purpose of Reliability, Availability, and Maintainability (RAM) modeling is quantifying system performance, typically in a future interval of time. A system is a collection of items whose coordinated operation leads to the output, generally a production value. The collection of items includes subsystems, components, software, human operations, etc. For example, an automobile can be considered as a system with sub-components being the drivetrain, engine, gearbox, etc. In RAM models, it is crucial to account for relationships between items to determine the final output of the system. In various industries, RAM models have proven to be effective as cost avoidance or decision-making tools, as well as their ability to confirm or counter stated assumptions by internal stakeholders.
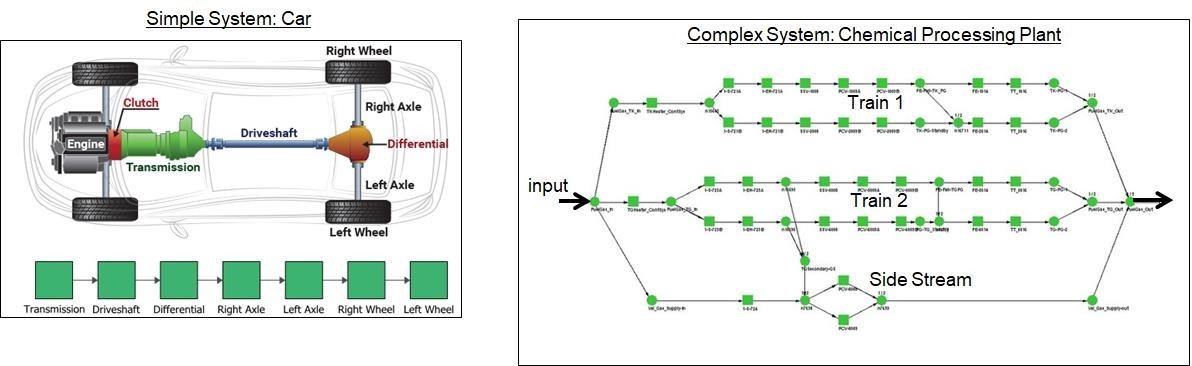
So in essence a RAM model is a “super-model” involving many aforementioned Asset Life Analysis models that make up the system.
Below is a short video from my website further explaining the RAM model concept.
The BPR Model
Barringer Process Reliability (BPR) was developed by Paul H. Barringer, a fellow Reliability Engineer “extraordinaire” and an outstanding mentor for myself and countless others in this field of practice. BPR highlights operational issues. Not addressed and mitigated, those could have significant revenue impacts. A BPR analysis uses the Weibull probability plot which happens to be a very well-known tool in the field of Reliability Engineering. On one side of a sheet of paper only, the BPR plot can tell the true “story” on the operation.
The Weibull technique and BPR graphics provide important information useful to a plant operator attempting to quantify production losses and/or seeking to solve business problems. One-page summaries as opposed to long reports, are very important for busy people, particularly senior leaders. Managers always look down on the process from a 10,000-foot level, and what they see matters differently than the field worker who is at the 1-foot level. By nature of their job and no fault to them, field workers always see the process from a low altitude where the view can be overwhelming due to a maze of problems.
In essence BPR is a 10,000 foot model that mimics the performance of an operation. Below is a short video from my website further explaining the BPR model concept.
Conclusion
Reliability Engineering defines other models such as Reliability Growth, Baysien or Accelerated Degradation models, just to name an extra few. At the end of the day, the process is the same. Developing a model to assess future performance of a system or asset.
When it comes to Mean Time Between Failures (MTBF), this is NOT a model. Rather just a single point defined by gross averages. Countless articles have been written on why to avoid using MTBF as a decision making process.
References
1 – Larry George, 2024, Do the Best You Can With Available Data?, Accendo Reliability.

Leave a Reply