The late quality guru W. Edwards Deming advised graphing the process variables and the process outputs across time on a run chart (a time-series plot) to identify uncertainty and variability. When the run charts are used together, they help to identify the times and causes of poor results.
Keywords: run chart, control chart, x-bar chart, line graph
If you want immediate control over a process, then track the process variables—those factors that influence the result—so that they are observable as they change. If the change is bad, you have time to react and correct it before it does too much damage. If you want preemptive control of a
process, then trend the variables of the process inputs before they enter the process. By ensuring that the inputs into a process are correct, you can be more certain that the process they feed will behave right. If you only want to know how well a process performed, then monitor its final outputs after process completion.
Unfortunately, if you only monitor final process outputs it puts you in the position of asking “what happened?” when something goes wrong. Just like the company in the following story, which had no idea what had changed to cause a spate of raw material stock-outs. By tracing the results of the replenishment process on two run charts the company exposed process fluctuations, and one phone call later, the underlying causes were revealed. Waiting to see what the process produced led them into a great deal of trouble that could have been avoided had they tracked the process inputs.
Inventory Replenishment Mayhem
The stock replenishment process of a national company involved the ocean shipment of raw material from a manufacturer on one side of the country to the company’s factory, located five shipping days away on the other side of the country. For some months prior to the investigation, the company had been running out of stock across a range of shipped materials. As a result, the company was unable to supply products on time to clients because the warehouse replenishment process could not maintain adequate raw material stocks. The company was using up safety stock and not getting resupply quickly enough to meet clients’ orders. Annoyed clients reported the problems that this was causing in strongly worded correspondence and angry telephone calls. The company did not know why it was having the stock-outs.
It was necessary to look at the history of deliveries from the manufacturer. Historical records of delivery dates are plotted in Figure 1, which is a run chart graph of the ship departure dates. It shows a great deal of variability in the deliveries over the most recent months. Lately, deliveries were up to two weeks overdue when they should have been arriving weekly.
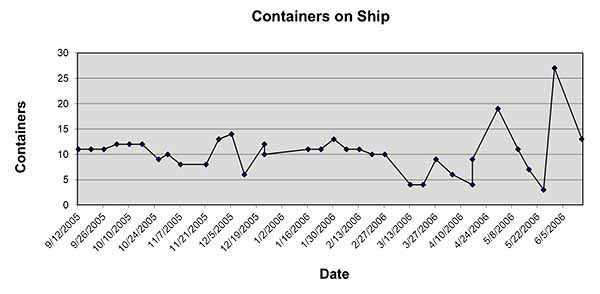
Figure 2 is a graph of the number of sea containers in each delivery. It shows variability in the amount of product sent in each shipment. Instead of having normal deliveries of 10 to 11 sea containers, the company was now receiving shipments ranging from 4 to 27 containers.
Inquiries with the freight forwarder revealed that the regular national shipping line used for deliveries had a two-month maintenance outage for one of its two ships. Whereas once there had been regular weekly shipments, now the only ship left was running fortnightly. To get ordered material to the factory during the maintenance outage, the manufacturer started booking transport with international shipping companies. These ships had irregular departure schedules and only took the number of sea containers needed to fill the empty bays that were left after meeting prior commitments. Sometimes they took a few containers, and other times they took many. The irregular departure of the international carriers with either small or large amounts of raw material resulted in the stock-out mayhem.
The company’s customers suffered because of the erratic supply of raw materials to the manufacturer. The irregularity was attributable to the high variability of international ocean shipping, which was further complicated by the feast-or-famine quantities of product on each ship. There were two possible responses to the temporary shipping problems until the return of the regular national carrier’s serviced vessel. The company could increase the order size shipped fortnightly, which would effectively raise its inventory levels in transit, or it could book transnational rail delivery. Most importantly, to prevent future stock-outs, the manufacturer needed to change its replenishment process to regularly monitor the ocean shipper’s plans and to check for possible delays in shipments.
The disruption of regular delivery to the company in the inventory replenishment example was the result of a “special cause” event—the ship repairs. A special cause event is an extraordinary occurrence in a process that is not attributable to the process itself. Had there been no ship repairs, the weekly deliveries most likely would have been normal. The ship repair was outside the control of the replenishment process, but it had a negative impact on it. If the manufacturer had of monitored the inputs into their shipping process, i.e. what the shipping line was doing, there would have been plentiful time to identify the problem and transport their raw materials by other means.
All the best to you,
Mike Sondalini
Director


 Ask a question or send along a comment.
Please login to view and use the contact form.
Leave a Reply