Use an Isocorrosion Diagrams To Recognise High Corrosion Situations And Design Process Equipment Accordingly. A true story of how a high nickel alloy (Alloy 28) reactor was holed in 8 weeks by sulphuric (sulfuric) acid running down the inside wall. When the situation was reviewed in detail using an iso-corrosion diagram for the alloy in sulphuric acid it was obvious that such a problem would occur. The iso-corrosion curves clearly showed the huge corrosion rates that would happen at local contact points within the reactor. A clear and detailed understanding of how to use iso-corrosion curves would have highlighted the problem at the design stage.
Keywords: corrosion rate, corrosion resistance, iso-corrosion curve, iso-corrosion diagram, nickel alloy corrosion
Explanation:
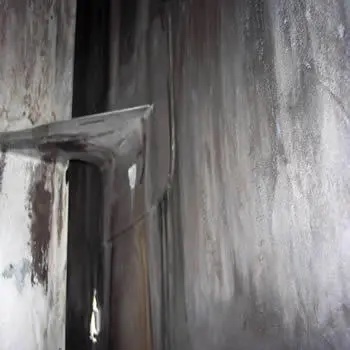
Below is a picture of the inside of an agitated Alloy 28 reactor showing a baffle mounted-off compensating plates. At the bottom of the picture you will notice a hole in the wall. Midway, the gusset has been thinned to razor sharp edges. Further up near the top is signs of corrosion on the compensating plate. The 5 mm thick wall was corroded in 8 weeks by sulphuric acid running down the baffle and wall.

The sulphuric acid was typically at 80% concentration and 20C at the injection point in the roof. No detrimental contaminants were present. When you look at the corrosion data for 80% sulphuric acid and 20C conditions it can be stored in a thick walled carbon steel tank with only minor metal loss. However as soon as the acid is diluted, or increases in temperature, or is aerated and receives more oxygen, or is contaminated by chlorides, then the corrosion rates skyrocket.
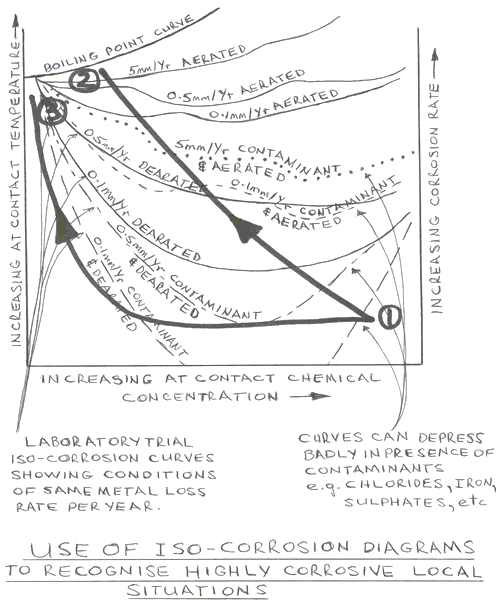
These sudden changes in the corrosion resistance of metals is best seen on an isocorrosion diagram showing iso-corrosion curves for different chemical strengths and equipment service environments. A stylised sketch of an iso-corrosion chart is shown below. Usually the data for the curves are developed from laboratory tests and as such are only indicative of real-world situations. The curves on the diagram show the conditions at which the amount of metal loss is the same.
A family of curves provide much better appreciation of the effect of changed conditions than just one curve. Sometimes it is necessary to superimpose data from several sources onto the one chart in order to build the family of iso-corrosion curves for yourself. The corrosion rates can rise fantastically with only a small change in temperature, concentration or contaminants.

What is important is to see what happens as the chemical concentration changes AND as the temperature changes AND as the availability of oxygen changes AND as the concentration of contaminants change … all at the same time.
Going back to the Alloy 28 reactor in which sulphuric acid was injected into a slurry of powder and water we can trace what happened to the corrosion chemistry on the isocorrosion diagram.
The sulphuric acid was added at high strength and low temperature when it first hit the wall (Point 1). When the main sulphuric acid stream contacted the water slurry a great amount of heat was generated. Within the reactor the bulk liquid temperature rapidly climbed to 120C and a great amount of steam was generated. The reactor was agitated to insure homogeneous acid mixing and temperature throughout the bulk liquid.
The acid that hit the wall and baffle ran down the surface of the alloy. As it ran down the acid continually absorbed moisture from the steam cloud in the reactor and diluted rapidly. The heat from the reaction radiated the tank walls warming them up. The lower part of the wall was also heated from the bulk liquid 120C temperature and conducted up the wall. All the while the thin streams of acid on the wall were now covering a relatively big surface area compared to the thin stream volume. The falling acid was directly exposed to oxygen in the air by the great billowing volumes of surging hot mist.
On the isocorrosion diagram you can see that the corrosion conditions on the reactor wall rapidly deteriorated in seconds and became terribly aggressive. All the worst conditions (Point 2) were at the lower part of the reactor where the hole developed.
To truly understand the real localised corrosion effects of chemicals on alloy metals it is necessary to develop an isocorrosion diagram of the worst conditions to be experienced. Once the worst local conditions are known the correct alloy with the best properties can be chosen. And/or the reactor redesigned to insure no harmful conditions are possible.
The problem was solved by simply moving the injection nozzle toward the center of the reactor. Once the massive corrosion rates caused by direct contact of acid on alloy were recognised, it was clear that if the acid was to first contact the bulk liquid and dilute in the bulk liquid, then the resulting acid concentration would have negligible effect on the alloy. This changed approach is shown by curve 3.
Disclaimer: Because the authors, publisher and resellers do not know the context in which the information presented in this article is to be used they accept no responsibility for the consequences of using the information contained or implied in any articles.
 Ask a question or send along a comment.
Please login to view and use the contact form.
Leave a Reply