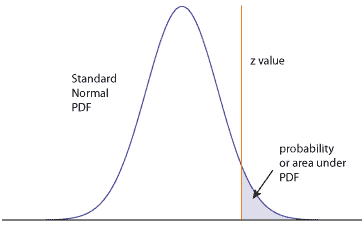
A skill needed for the CRE exam is the ability to look up probabilities given a z-value using a standard normal table. It’s old school, I know, yet without software, you most likely will have to find a few values in this manner.
A z-value is the number of standard deviations from the mean at least that’s how I think of it. The area under the curve to the right or left of the z-value is then the probability of interest. Of course, I’m talking about the normal distribution probability density function or what we commonly all the ‘bell-shaped’ curve.
Before I describe how to read a value from a table, keep in mind that not all standard normal tables are the same. Some provide the area under the left tail, other the right tail. Some provide only half the values starting at zero and moving to the right (or left) only. Others provide values from negative or positive infinity. Most have a hand graphic with an indication of what area under the curve the table describes.
Be familiar with your table and practice finding values quickly. I would even suggest writing down in your notes some commonly used values, i.e. one side values z and corresponding probabilities:
z ~ probability
1.28 ~ 0.10
1.645 ~ 0.05
2.236 ~ 0.01
2.576 ~ .005
(be sure to double check these values)
Of course, the exam writers know the common values and may ask for an uncommon value to test your table reading skills. Interpolation is also something to practice.
 The table I have in the back on the CRE Primer from the Quality Council of Indiana has a normal plot similar to this one. It is showing that the values are the area under the curve to the right of the z value.
The z-values are composed of values first two digits in the first column of the table, then the third digit along the first row of the table. For a z-value of 1.65, I first find the row corresponding to 1.6 in the first column (labeled Z), then look for the X.X5 in the top row. At the intersection of the 1.6 row and X.X5 column is the value 0.0495.
| Z | … | X.X3 | X.X4 | X.X5 | X.X6 | … |
| … | … | … | … | … | … | … |
| 1.5 | … | 0.0630 | 0.0618 | 0.0606 | 0.0594 | … |
| 1.6 | … | 0.0516 | 0.0505 | 0.0495 | 0.0485 | … |
| 1.7 | … | 0.0418 | 0.0409 | 0.0401 | 0.0392 | … |
| … | … | … | … | … | … | … |
If on the other hand, I want to find the z-value corresponding to a probability of 0.05 (or 5%) we would have to interpolate between the values 0.0505 and 0.0495. Both are on the 1.6 row, so those are the first two digits. The third value is midway between X.X4 and X.X5, so we have 1.645 as the resulting z-value corresponding to a probability (area under the curve to the right) of 0.05.
I always draw out the problem and double check which area or z-value I’m seeking. Be familiar with your table and take care with interpolation. And, you’ll be fine.
Related:
How to read a standard normal table (article)
Reading a Standard Normal Table (article)
Interpolation within Distribution Tables (article)
 Ask a question or send along a comment.
Please login to view and use the contact form.
Leave a Reply