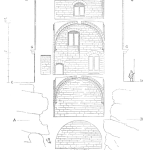
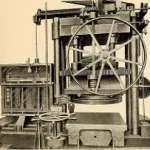
Dear friends, we are glad to release this interesting video. In this video, Hemant Urdhwareshe explains procedure for probability plotting of failure data in Exponential Distribution using Excel. Hemant is a Fellow of ASQ and is certified as CRE, Six Sigma Master Black Belt, CQE and CMQ/OE by ASQ.
[Read more…]Articles
Find all articles across all article series listed in reverse chronological order.
How RCM Transforms Your Reliability Culture
In today’s video, I’m at Lover’s Leap in Chattanooga, Tennessee, exploring how to build an effective Reliability Culture using Reliability Centered Maintenance (RCM). A common challenge in many organizations is the disconnect between teams — Maintenance, Operations, and upper management aren’t always on the same page, which can lead to costly downtime, safety issues, and inefficiencies.
But there’s hope. By adopting a Facilitated working group approach to RCM, you can bring your teams together with a shared goal — good Reliability. In this video, I share how RCM can foster understanding amongst team members, break down silos, and create an effective Reliability Culture that leads to better performance and a solid Return on Investment (ROI).
Key Points Covered:
- The impact of team misalignment on Reliability
- How RCM brings Maintenance, Operations, and Management together
- Why cultural change is a powerful outcome of RCM
- The long-term benefits of implementing RCM for your organization
- Don’t let your teams operate like feuding families!
Watch the full video to see how RCM can help transform your organization over time.
[Read more…]FMEA Quality Objective 1: FMEA PLAN
Good fortune is what happens when opportunity meets with planning Thomas Edison
As summarized in the first article in this series, “New Series – The Quality of FMEAs,” each month, I will write an article focusing on one of the 14 FMEA Quality Objectives. The intent is to provide insights and application tips for evaluating how well an FMEA meets the quality objectives. By learning to apply FMEA quality objectives, you can help to ensure that product designs and manufacturing processes are safe and reliable. If you didn’t read the introductory article, now is a good time to read it, since it explains FMEA Quality Objectives, and how they are used to create high-quality FMEAs.
In this article, I will outline how to evaluate an FMEA Plan against the FMEA Quality Objective for FMEA Plans.
What is GR&R (video)

Gage repeatability and reproducibility (GR&R) is a statistical tool used in quality control to assess a measurement system’s capability. It evaluates the amount of variation in the measurement data that is due to the measurement system itself rather than the product being measured. GR&R helps to determine if a measurement system is reliable and whether it’s producing repeatable and reproducible measurements.
[Read more…]Pakistan Budgets with MTBF

Now for something completely different. Roaming the net looking for an interesting advertisement or data sheet with a ‘great’ (i.e. bad) example of the mis use of MTBF, ran across that MTBF is actually being used by at least one government for department budgeting.
[Read more…]CMMS & EAM Implementation Errors and What to do About Them

You probably have a computerized system for managing maintenance. It might be part of your integrated management software, like Oracle, or SAP. The business cases for initial purchase of these systems often include forecast cost savings of 20% or more. Most of the time, they fall far short of that. In fact, the costs of the new system, its implementation, the staff required to support and run it, the training needed for users, can easily grow bigger than the costs you had before the system was implemented.
[Read more…]A Common Misunderstanding about Reliability Centered Maintenance

Reliability Centred Maintenance (RCM) was developed by the aircraft industry and it has now migrated into industries across the world. The aircraft industry does RCM differently to other industries. RCM fails in general industry because inherent problems in the business design of most organisations are prevented in the airline industry with business processes imposed by legal regulation. Using the RCM methodology does not instil the business disciplines needed for RCM to deliver its benefits.
[Read more…]Are you in Control of Your Risk

Guest Post by Annette Davison Ph.D (first posted on CERM ® RISK INSIGHTS – reposted here with permission)
According to the definition in ISO 31000, risk is the impact of uncertainty on [achieving] your objectives. Of course, this impact can be both negative or positive. ISO 31000 states the following:
“Clause 6.4.2 Risk identification: The organisation should identify risks, whether or not their sources are under its control.
Clause 6.4.3 Risk analysis: The effectiveness of existing controls.”
[Read more…]The 1.5 Sigma Shift: What It Is and Why It Matters
One of the most persistent points of confusion in quality engineering is the difference between traditional statistical process capability analysis and the Six Sigma approach. Specifically, why does Six Sigma define a “six sigma” process as having 3.4 defective parts per million (DPPM), when a straightforward application of statistical tables suggests that six standard deviations from the mean should correspond to a far lower defect rate—about 2 parts per billion? The answer lies in what Six Sigma practitioners call the 1.5 sigma shift.
[Read more…]Remember this Memoryless Exponential Distribution!

Dear friends, I am happy to release our 59th video on Exponential Distribution! Exponential Distribution is an appropriate mathematical model when failure or hazard rate is constant. It is often known as “Memoryless” as reliability in any time interval is same! Exponential Distribution has many applications in Reliability Engineering such as electronic components. Many reliability procedures in MIL Standards assume constant failure rate and Exponential Distribution! Hope you find the video interesting and useful! Your feedback is welcome! Do subscribe to our channel to get updates on our new videos and programs!
[Read more…]The Execution Gap: Why People Don’t Follow Through on Work

In the world of work, execution is key. It’s not just about having great ideas or making ambitious plans; it’s about turning those ideas into action and seeing plans through to completion. However, despite our best intentions, many of us struggle to execute work effectively. So, why is this? What causes the execution gap? Let’s explore some common reasons why people fail to execute work and how we can overcome these challenges.
[Read more…]What is the P-F Interval? A Quick Guide to Condition Based Maintenance

In this short video, I explain the concept of the P-F Interval and its crucial role in Condition Based Maintenance (CBM). Understanding the P-F Interval is essential for determining how often to perform CBM tasks (and Predictive Maintenance task intervals) to catch Potential Failures before they become full-blown failures. Learn how the time between detecting a Potential Failure Condition and the point of failure — known as the P-F Interval — guides your inspection intervals and helps ensure reliability.
[Read more…]Three Solutions for Reliability Professionals Making Big Presentations

Communicating effectively is essential when big decisions are at hand, especially for reliability professionals presenting to senior management or boards. However, most of us do not receive formal training or have tailored strategies for big, high-stakes presentations. This guide offers three practical solutions to enhance your presentation skills.
[Read more…]Leveraging Bayesian Statistics for Reliability Predictions with Limited Sample Data

Example from BDC Motor Reliability Assessment
Reliability analysis is essential for ensuring long-term performance of hardware components. However, predicting failures with small sample sizes is a challenge. Traditional statistical methods often require large datasets, whereas Bayesian statistics can incorporate prior knowledge to improve predictions by updating beliefs as new data becomes available.
[Read more…]Graphical Representations in Reliability Analytics

Introduction
Reliability Engineering analytics come with graphs and visual representations providing the analyst with various types of key information. Some graphs are more popular than others. This article highlights the 4 main graphs used in Reliability Engineering Analysis.
They are Reliability, Probability of Failure, Probability Density and Failure Rate. Less common types are not covered here. Such as Contour Plots. The basis of the graphs in this article is the Weibull Distribution. In other words, all the graphs derive from this very popular distribution. The same concepts applies to other distributions.
[Read more…]
Ask a question or send along a comment.
Please login to view and use the contact form.