Accendo Reliability

Your Reliability Engineering Professional Development Site

  • Home
  • About
    • Contributors
    • About Us
    • Colophon
    • Survey
  • Reliability.fm
    • Speaking Of Reliability
    • Rooted in Reliability: The Plant Performance Podcast
    • Quality during Design
    • CMMSradio
    • Way of the Quality Warrior
    • Critical Talks
    • Asset Performance
    • Dare to Know
    • Maintenance Disrupted
    • Metal Conversations
    • The Leadership Connection
    • Practical Reliability Podcast
    • Reliability Matters
    • Reliability it Matters
    • Maintenance Mavericks Podcast
    • Women in Maintenance
    • Accendo Reliability Webinar Series
  • Articles
    • CRE Preparation Notes
    • NoMTBF
    • on Leadership & Career
      • Advanced Engineering Culture
      • ASQR&R
      • Engineering Leadership
      • Managing in the 2000s
      • Product Development and Process Improvement
    • on Maintenance Reliability
      • Aasan Asset Management
      • AI & Predictive Maintenance
      • Asset Management in the Mining Industry
      • CMMS and Maintenance Management
      • CMMS and Reliability
      • Conscious Asset
      • EAM & CMMS
      • Everyday RCM
      • History of Maintenance Management
      • Life Cycle Asset Management
      • Maintenance and Reliability
      • Maintenance Management
      • Plant Maintenance
      • Process Plant Reliability Engineering
      • RCM Blitz®
      • ReliabilityXperience
      • Rob’s Reliability Project
      • The Intelligent Transformer Blog
      • The People Side of Maintenance
      • The Reliability Mindset
    • on Product Reliability
      • Accelerated Reliability
      • Achieving the Benefits of Reliability
      • Apex Ridge
      • Field Reliability Data Analysis
      • Metals Engineering and Product Reliability
      • Musings on Reliability and Maintenance Topics
      • Product Validation
      • Reliability by Design
      • Reliability Competence
      • Reliability Engineering Insights
      • Reliability in Emerging Technology
      • Reliability Knowledge
    • on Risk & Safety
      • CERM® Risk Insights
      • Equipment Risk and Reliability in Downhole Applications
      • Operational Risk Process Safety
    • on Systems Thinking
      • Communicating with FINESSE
      • The RCA
    • on Tools & Techniques
      • Big Data & Analytics
      • Experimental Design for NPD
      • Innovative Thinking in Reliability and Durability
      • Inside and Beyond HALT
      • Inside FMEA
      • Institute of Quality & Reliability
      • Integral Concepts
      • Learning from Failures
      • Progress in Field Reliability?
      • R for Engineering
      • Reliability Engineering Using Python
      • Reliability Reflections
      • Statistical Methods for Failure-Time Data
      • Testing 1 2 3
      • The Manufacturing Academy
  • eBooks
  • Resources
    • Accendo Authors
    • FMEA Resources
    • Glossary
    • Feed Forward Publications
    • Openings
    • Books
    • Webinar Sources
    • Journals
    • Higher Education
    • Podcasts
  • Courses
    • Your Courses
    • 14 Ways to Acquire Reliability Engineering Knowledge
    • Live Courses
      • Introduction to Reliability Engineering & Accelerated Testings Course Landing Page
      • Advanced Accelerated Testing Course Landing Page
    • Integral Concepts Courses
      • Reliability Analysis Methods Course Landing Page
      • Applied Reliability Analysis Course Landing Page
      • Statistics, Hypothesis Testing, & Regression Modeling Course Landing Page
      • Measurement System Assessment Course Landing Page
      • SPC & Process Capability Course Landing Page
      • Design of Experiments Course Landing Page
    • The Manufacturing Academy Courses
      • An Introduction to Reliability Engineering
      • Reliability Engineering Statistics
      • An Introduction to Quality Engineering
      • Quality Engineering Statistics
      • FMEA in Practice
      • Process Capability Analysis course
      • Root Cause Analysis and the 8D Corrective Action Process course
      • Return on Investment online course
    • Industrial Metallurgist Courses
    • FMEA courses Powered by The Luminous Group
      • FMEA Introduction
      • AIAG & VDA FMEA Methodology
    • Barringer Process Reliability Introduction
      • Barringer Process Reliability Introduction Course Landing Page
    • Fault Tree Analysis (FTA)
    • Foundations of RCM online course
    • Reliability Engineering for Heavy Industry
    • How to be an Online Student
    • Quondam Courses
  • Webinars
    • Upcoming Live Events
    • Accendo Reliability Webinar Series
  • Calendar
    • Call for Papers Listing
    • Upcoming Webinars
    • Webinar Calendar
  • Login
    • Member Home
Home » Articles » on Maintenance Reliability » The Reliability Mindset » Building a PF Curve Using Life Analysis Concepts

by André-Michel Ferrari Leave a Comment

Building a PF Curve Using Life Analysis Concepts

Building a PF Curve Using Life Analysis Concepts

Definition of a PF Curve

A PF curve is a graphical tool used in the field of maintenance and reliability. It essentially illustrates a component’s health degradation over its lifetime. As well as a visual guide on when to conduct appropriate action to minimizes operational risks related to unplanned failures. It is essentially a planning tool.

The PF Curve is a combination of Condition Based Monitoring (CBM) tasks and Repairs (or Corrective Maintenance) tasks. Below is a classical PF curve with asset consumed life on the horizontal axis. The asset starts operating at time zero. The vertical axis indicates the health or the condition of the asset at a specific moment in its life. When we install or commission the system at time zero, the health index is close to or at 100%. As we move away from time zero, the condition typically degrades and the health index decreases. When the asset is at its end of life, the health index is close to or at zero.

Graph 1 – Generic PF curve with 2 P points

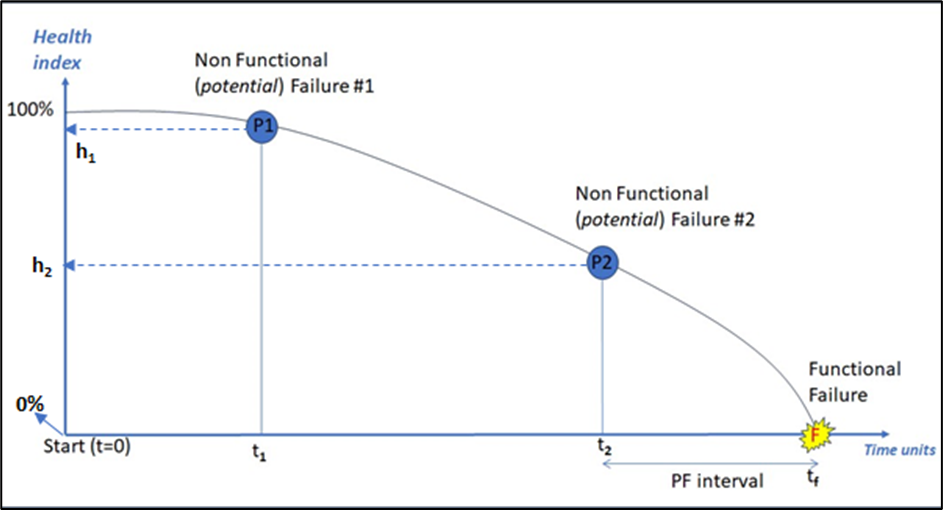
In the PF acronym, P stands for Potential (related to a failure) and F for Functional (also related to a failure). A potential failure or non-functional failure means that the asset is showing initial signs of degradation yet still performing its function. CBM procedures detect non-functional failures. Such as Vibration, Infrared or Oil Analysis. Human senses cannot detect those degradation thresholds. A functional failure is when the asset losses is function completely. A typical functional failure is obvious to the operator. A repair task usually follows.

Using the PF Curve

One of the most important outputs of a PF curve is what we call the PF interval. In Graph 1 above, it is the time interval tf minus t2. This is the time from an advance degraded condition (P2 here) to the time we lose total function of the asset (F). Note, that we could equally have used P1 as the reference point. F can also be qualified as the “end of life” stage.

The PF interval informs the operator after reaching the detectable degraded condition, in this case P2, how much time they have left to mitigate the total failure of the asset. We want to avoid reaching the F point. Mitigation will be a planned repair which is shorter and more controlled. If we reach the failure point without mitigation, we end up with an unplanned failure with many adverse consequences for production, employee safety as well as high repair costs.

The PF interval is crucial because, if the repair is a complex or costly job, the PF interval gives the operator time to plan and budget for the repair. These include preparing for production downtime, getting spare parts and having a repair plan ready. Note that the mitigative action could be a repair, a restoration task or it could be entirely replacing the asset itself. Therefore, the PF interval is very useful to an operator who has a large number of assets to manage and maintain but has limited maintenance resources to execute the work. The correct PF interval will allow for planning and execution of all the required repairs in an optimized schedule. This also avoids repairing too early which is costly, or repairing too late which is risky.

Defining the PF point using Life Analysis

In general literature it is not clear how to build PF curves. Specifically, the time intervals for the P and F points. Is Mean Time Between Failures (MTBF) used? Or is it something else?

I prefer to use Life Analysis as a more rigorous approach. Life Analysis involves using degradation records to build a statistical life model.  In the case of a 2-point PF curve (i.e. one P point and one F point), we will have to build 2 statistical models. One for the CBM degradation threshold (P) and the other for the functional failure (F). Therefore, we need two sets of degradation records. Those life models take into account the true evolution of the component degradation.  

The question now comes to: how are the P and F point defined using those life models? It depends on the analyst. It can either be the characteristic life value or the scale parameter if the model derives from a Weibull distribution. One can also define a probability of event occurrence time value. For example, the time where we have 90% probability of degradation or failure. And again, both for the P and F points.

Here is a real life PF curve example below presented at LRVS AMERICA 2024.

Graph 2 – PF curve with 2 points for Roller Bearings

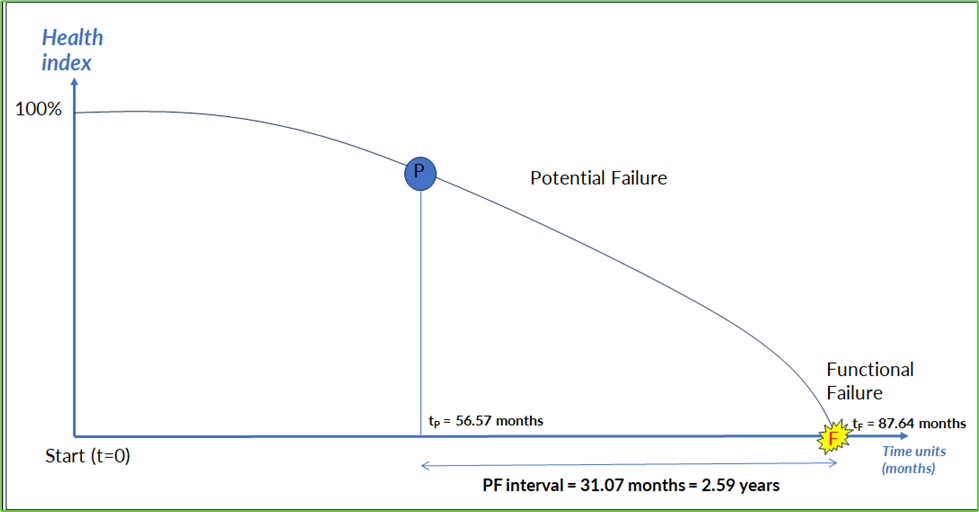
The example relates to roller bearings where we use Vibration Analysis as the CBM method. Two degradation models are defined for the P and F point respectively as follows.

  • P point: Weibull 2 parameter distribution: Beta (shape parameter) = 1.43; Eta (scale parameter) = 56.57 months
  • F point: Weibull 2 parameter distribution: Beta (shape parameter) = 1.62; Eta (scale parameter) = 87.64 months

In this case, we use the Characteristic Life (Eta) as the P and F points. The PF interval as shown in Graph 2 is 31.07 months or 2.59 years.

The reader will notice a glaring omission in Graph 2. The graph does not specify nor illustrate a health index for the P point. It is omitted because what is of interest to the user is the PF interval. The health index value does not allow for any decision making in this case. It can be back calculated using the ratio tp/tf.

In summary, the question becomes: is the PF curve of any value to the maintenance and reliability practitioner? Since the PF interval happens to be the most important element and can be calculated separately. Comments from the readers on the above question are more than welcome.

Filed Under: Articles, on Maintenance Reliability, The Reliability Mindset

About André-Michel Ferrari

André-Michel Ferrari is a Reliability Engineer who specializes in Reliability Analytics and Modeling which are fundamental to improving asset performance and output in industrial operations.

André-Michel has approximately 30 years of industrial experience mainly in Reliability Engineering, Maintenance Engineering, and Quality Systems Implementation. His experience includes world-class companies in the Brewing, Semiconductor, and Oil & Gas industries in Africa, Europe and North America.

« What is Wrong With Success Testing?
How to not Suck at Probability and Statistics »

Leave a Reply Cancel reply

Your email address will not be published. Required fields are marked *

The Reliability Mindset logo Photo of André-Michel FerrariArticles by André-Michel Ferrari
in the The Reliability Mindset: Practical Applications in Industry article series

Join Accendo

Receive information and updates about articles and many other resources offered by Accendo Reliability by becoming a member.

It’s free and only takes a minute.

Join Today

Recent Posts

  • Response Surface Designs: Part-1 Addition of Centerpoint
  • The Standard for Reliability Centered Maintenance (RCM)
  • Design Change Implementation
  • 3 MTBF Stories
  • Machines only Stop Working after their Parts Fail 

© 2025 FMS Reliability · Privacy Policy · Terms of Service · Cookies Policy

Book the Course with John
  Ask a question or send along a comment. Please login to view and use the contact form.
This site uses cookies to give you a better experience, analyze site traffic, and gain insight to products or offers that may interest you. By continuing, you consent to the use of cookies. Learn how we use cookies, how they work, and how to set your browser preferences by reading our Cookies Policy.