
Attribute inspection is one of the most widespread and difficult-to-control measurement methods in manufacturing. Whether inspecting machined surfaces for cosmetic defects, checking weld quality, reviewing molded parts, evaluating assembly completeness, or using go/no-go gauges, many operations depend on human inspectors to make subjective judgments.
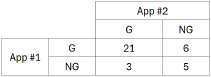
To evaluate these inspection systems, many organizations still rely on observed agreement, the simplest measurement of consistency. Unfortunately, attempts to understand the variation introduced by an attribute gage are frequently led astray by an excellent observed agreement study masking an unreliability measurement system.Let’s consider a case study in which two appraisers evaluate an attribute gage pin by each measuring the same 35 samples with the gage and comparing their results. Each appraiser declares each of the 35 samples as either “G” or “NG” on the basis of the output of the attribute gage. A useful presentation of the study data follows:
Observed agreement (Po) represents the proportion of parts on which two inspectors — or an inspector and a master standard — give the same classification. To calculate it, you count the number of times both evaluations match (e.g. both calling a part G or both calling it NG) and divide that by the total number of parts inspected. For a G/NG inspection,
$$ \displaystyle P_{o}=\frac{n_{GG}+n_{NG\,NG}}{N} $$
where N is the total number of parts.
In our case study, the appraisers agreed 21 times that the sample was Good (nGG) and 5 times that the sample was Not Good (nNGNG) for a total of 26 points of agreement in 35 opportunities (N) yielding,
$$ \displaystyle P_{o}=\frac{21+5}{35}=74.3\% $$
While observed agreement is easy to compute and widely understood, it often overestimates the true reliability of a gage system, especially when one category (usually G) dominates the population.
If 95% of all parts are “Good,” then an inspector who simply calls everything “Good” will achieve 95% agreement, even if they cannot properly detect defects. This false sense of capability leads to poor decisions and recurring quality escapes.
To avoid this trap, quality engineers can use Cohen’s Kappa, K, a statistical measure of agreement beyond chance. Kappa tells you how much appraisers agree in a meaningful way, not merely due to guesswork.
In attribute gage studies, Kappa can be used to quantify:
- Repeatability – Does the same inspector classify the same part consistently across trials?
- Reproducibility – Do multiple inspectors agree with each other?
- Accuracy – Does the inspector’s classification match a reference or master standard?
Observed agreement treats all agreement as equally meaningful. Kappa corrects this bias by asking:
Given how each inspector tends to classify items, how much agreement would we expect purely by chance?
This makes Kappa far more reliable in evaluating human classification systems, especially those involving G/NG decisions.
The Core Formulas: Po, Pe, and Kappa
At this point in our discussion, we understand that Po is the observed agreement of our study, the ratio of the total number of times the two appraisers agreed about a sample’s inspection status to the total number of samples in the study. But another critical question is, what is the probability that our appraisers declared the same inspection status by pure chance? This is where Expected Agreement (![]() ) enters the discussion.
) enters the discussion.
![]() is how often the inspectors would agree just by chance, based on how frequently each uses each category. And this total expected agreement is naturally the sum of the expected agreement of G and the expected agreement of NG.
is how often the inspectors would agree just by chance, based on how frequently each uses each category. And this total expected agreement is naturally the sum of the expected agreement of G and the expected agreement of NG.
For a 2×2 G/NG system:
Pe = PG + PNG
PG = (number of GApp 1 / Total) * (number of GApp 2 / Total)
PNG = (number of NGApp 1 / Total) * (number of NGApp 2) / Total)
Drawing from the data in Table A in our case study,
PG = ((21 + 6) / 35) * ((21 + 3) / 35) = .529
PNG = ((3 + 5) / 35) * ((6 + 5) / 35) = .072
Pe = .529 + .072 = .601
Once you have and
![]() , calculating Cohen’s Kappa, K is straightforward:
, calculating Cohen’s Kappa, K is straightforward:
$$ \displaystyle \kappa=\frac{P_{o}-P_{e}}{1-P_{e}} $$
Again referring to our case study,
$$ \displaystyle \kappa=\frac{.743-.601}{1-.601}=.356 $$
A quality engineer’s interpretation of Kappa will vary with industry and application, but a good starting point for interpreting values of Kappa can be found in Table B.
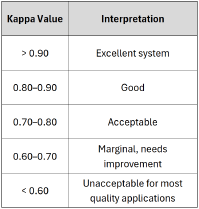
A Kappa of 1 implies perfect agreement. A Kappa of 0 implies no agreement beyond what chance produces. Kappa values can also go negative, in other words, worse than chance, implying systematic disagreement. This unusual case is typically caused by a structural problem with the inspection process e.g. a misunderstanding about what is G and NG, recording data incorrectly, etc.
In our case, even though the inspectors agree 74.3% of the time, once chance agreement is removed, the true agreement is only 35.6%, an unacceptable result in most environments.
This means the attribute inspection system needs improvement, possibly via:
- Better-defined cosmetic or defect acceptance standards
- Boundary samples
- Lighting, magnification, or fixture improvements
- Inspector training or calibration
This example demonstrates why Kappa is essential for meaningful attribute gage analysis. Observed agreement alone masks underlying variability and can allow an unreliable inspection system into production.
Human classification systems are among the most variable measurement systems in manufacturing. But Cohen’s Kappa provides a rigorous, chance-corrected measure of inspection consistency and is one of the most important tools for evaluating:
- Visual inspection
- Go/no-go attribute checks
- Defect classification
- Assembly verification
- Weld and NDT/NDE categorical decisions
For manufacturing quality engineers, reliability engineers, and process engineers, understanding and applying Kappa is essential for ensuring reliable attribute gage performance and preventing costly inspection errors.
Ray Harkins is the General Manager of Lexington Technologies in Lexington, North Carolina. He earned his Master of Science from Rochester Institute of Technology and his Master of Business Administration from Youngstown State University. He also taught over 120,000 student quality-related skills such as Reliability Engineering Statistics, An Introduction to Reliability Engineering, Quality Engineering Statistics, An Introduction to Quality Engineering, Root Cause Analysis and the 8D Corrective Action Process, Process Capability Analysis, and Return on Investment Analysis for Manufacturing through the online learning platform, Udemy. He can be reached via LinkedIn at linkedin.com/in/ray-harkins or by email at the.mfg.acad@gmail.com.

Leave a Reply