
Parameter Definition in Statistics
In statistics, parameters are numerical characteristics that describe a population or distribution. They summarize important aspects of the population. For example, in a normal distribution, the mean and variance are key parameters that define the distribution. Parameters are often denoted by Greek letters (e.g., μ for mean) and are used to create a parametric family, which consists of all distributions defined by the same parameters.
There is typically at least one parameter in every distribution. Some distributions can have different multiples of parameters. The exponential can have up to two, the lognormal have up to 3. This article deals with the Weibull distribution which can have 2 or 3 parameters.
The Weibull Distribution
The Weibull distribution is a very popular distribution used in Reliability Engineering analytics. Sometimes a little to popular. Discovered and published by Waloddi Weibull back in 1939, the 2 parameter Weibull has the unique capability to model a large variety of mechanical and material failures. The two parameter Weibull is governed by the following parameters.
- Beta (Greek letter β): Shape parameter
- Eta (Greek letter η): Scale parameter
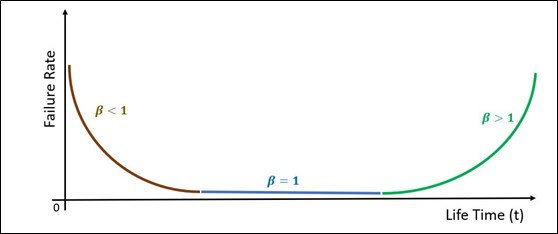
The Beta parameter is highly informative and depending on its value, can provide the analyst with pertinent information on the life characteristics of a population studied. One of the best-known outcomes of the Weibull 2 parameter distribution is the Bathtub Curve. It is a combination of at least 3 Weibull distributions (2 Parameter Weibull) where Beta takes multiple values as shown in Diagram 1 below.
The Weibull 3 Parameter Distribution
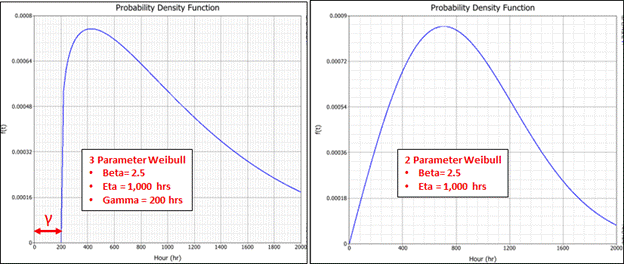
The Weibull 3 Parameter Distribution is similar to the 2 Parameter one. Except that in addition to the shape and scale parameter, it has a third parameter, the location parameter Gamma (Greek letter γ).
The location parameter is also known as the failure free life. It is an offset value where no failures are expected to occur as shown in Graph 1 below. In other words, it determines the point at which the distribution begins (t=γ) as shown in the left graph below. In real terms, it is the time when a component is turned on or put into use.
Applications of the Weibull 3 Parameter Distribution
The 3 Parameter Weibull can be applied to spare parts in storage or unsold items sitting on a store shelf. But not exclusively.
- The spare part’s operating life or degradation process per se, starts when it leaves inventory and is put to use in equipment.
- The camera sitting on the vendor’s shelf, starts its life then a customer purchases it and operates it.
For the above examples, the time represented by Gamma (γ) is the failure free period and is not subject to any form of stress or degradation mechanisms. It is fair to assume that the environmental conditions during the failure free period are adequate and again, don’t contribute to any form of degradation. Also, we start measuring the life of the item before it is put in use. In the above examples, that’s when the spare part is put in inventory or when the camera is placed on the vendor’s shelf. Or when both items above leave the manufacturing plant.
Using the 3 Parameter Weibull requires good engineering judgment. If this type of distribution comes up as the best fit in a Life Analysis exercise, the analyst should double check if a failure free period applies in reality. On other words, ask: can this component have a failure free period in its lifetime? Conversely as I have often witnessed, the 3 Parameter Weibull is used as the best fit but the reality of the component is different. That would be incorrect and lead to poor decision making.

Leave a Reply