
Field data analysis starts with the collection of data.
In a previous article, we used a Nevada chart to gather the counts per month of field failure data. The chart also provides the necessary data to account for how many units have not failed as of yet.
The Nevada chart on its own is just a table of numbers and does not reveal patterns of the changing nature of failure rates over time. Are we experiencing early life failures or wear-out related failures?
We need to conduct some data analysis to learn what message the data contains.
Basic Weibull field failure analysis
For non-repairable time to failure data, I fit the data to a Weibull distribution. It’s where I start the field data analysis. The Weibull distribution is versatile as it’s able to adequately describe a wide range of time to failure data patterns. Plus, it is easy to interpret.
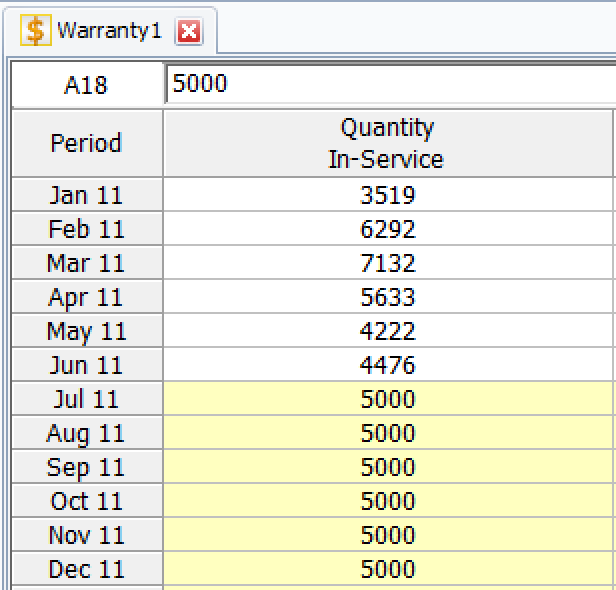
Given we have the Nevada chart of data, I opened a Warranty folio in Weibull++ (from Reliasoft). We need to enter the data into two tabs. The first is for the Sales or units shipped. We have monthly data, so we entered the data as follows.
Next, enter the failure count data again by month and by month shipped.

I left everyone concerning the fit at defaults for a two-parameter Weibull using a rank regression fitting method. Tapping “Calculate,” we find the Weibull parameters of Beta of 1.31 and Eta of 123 months.
The analysis step
The beta is informative yet, let’s first take a look at the plot to see how well the fit described the data.
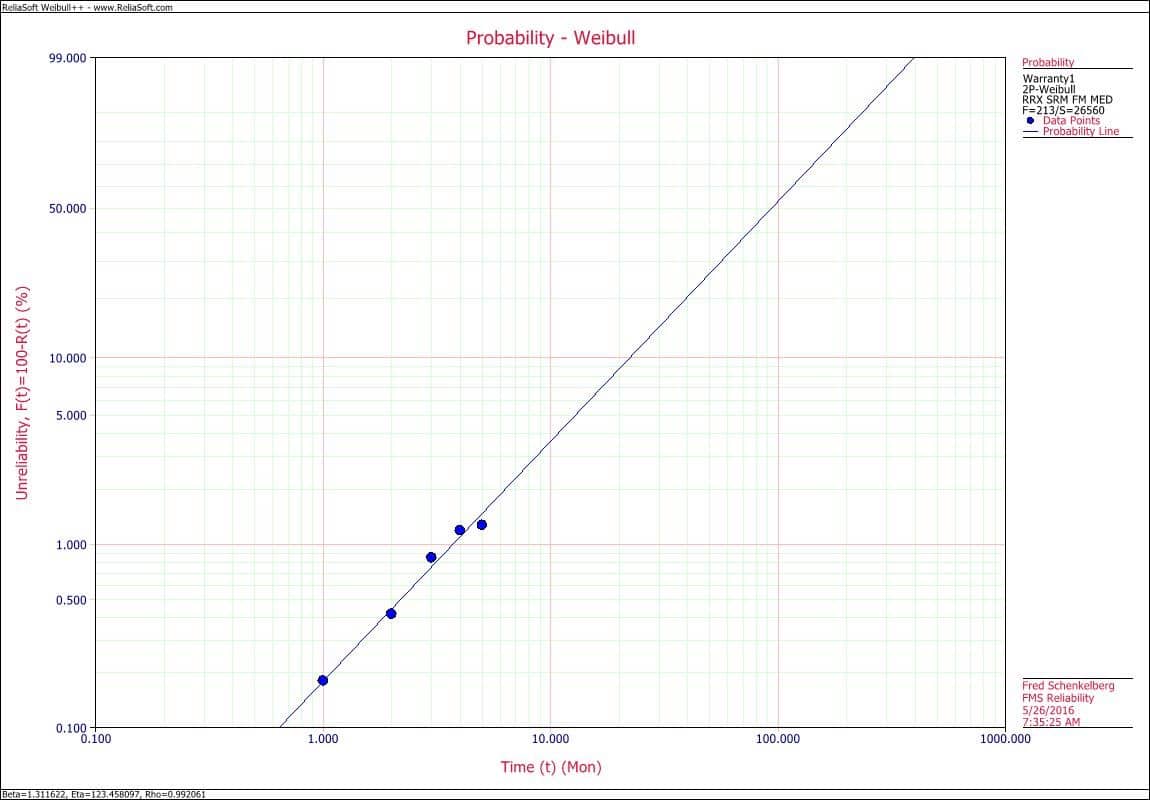
The fitted line follows the data well. Of course, there are statistical tests to determine the goodness-of-fit, yet for now, this looks pretty good. This is just a first look at the data.
Back to the meaning of the beta value. A beta of 1.3 indicates an increasing failure rate over time. As the units remaining service longer, the chance of failure increases.
The issue is will the tally of failures or risk of failure for those using the product be acceptable?
The Weibull plot is a cumulative distribution function (CDF) plot. The CDF is plotted using special scales such that if the data does fit the Weibull distribution, the data point and fitted line will be a straight or nearly straight line. Typically, a plot has the x-axis with months (or units of time, cycles, etc., depending on the data) and the probability of failure (unreliability) on the y-axis.
At about 3 months of use, there is approximately a 1% chance of failure. At one year (12 months), there is approximately a 15% chance of failure. Nearly all units will fail by 10 years of use.
These values represent the actual data as collected using the Nevada chart out to 6 months. Beyond that time is an extrapolation and provides a forecast of future performance is the same basic pattern of failures remains consistent with the failures seen within the data collection period.
For our situation, compare the field data to the expected reliability performance. Plus, work to understand if the current rate of failure is acceptable for your customers.
The goal and/or the current performance may or may not meet the customer’s expectations thus check.
Forecasting the number of failures
If you are staffing a repair center or ordering replacement units to honor warranty claims you may want to know how many failures to expect going forward.
The Weibull++ software package within the Warranty folio can calculate an extension to the Nevada chart. You need to enter how many months into the future you want to forecast and the future months of production/shipping that will likely occur.
Here I forecast out 6 months with 5,000 units forecast to ship each month. The result is an extension of the Nevada chart.
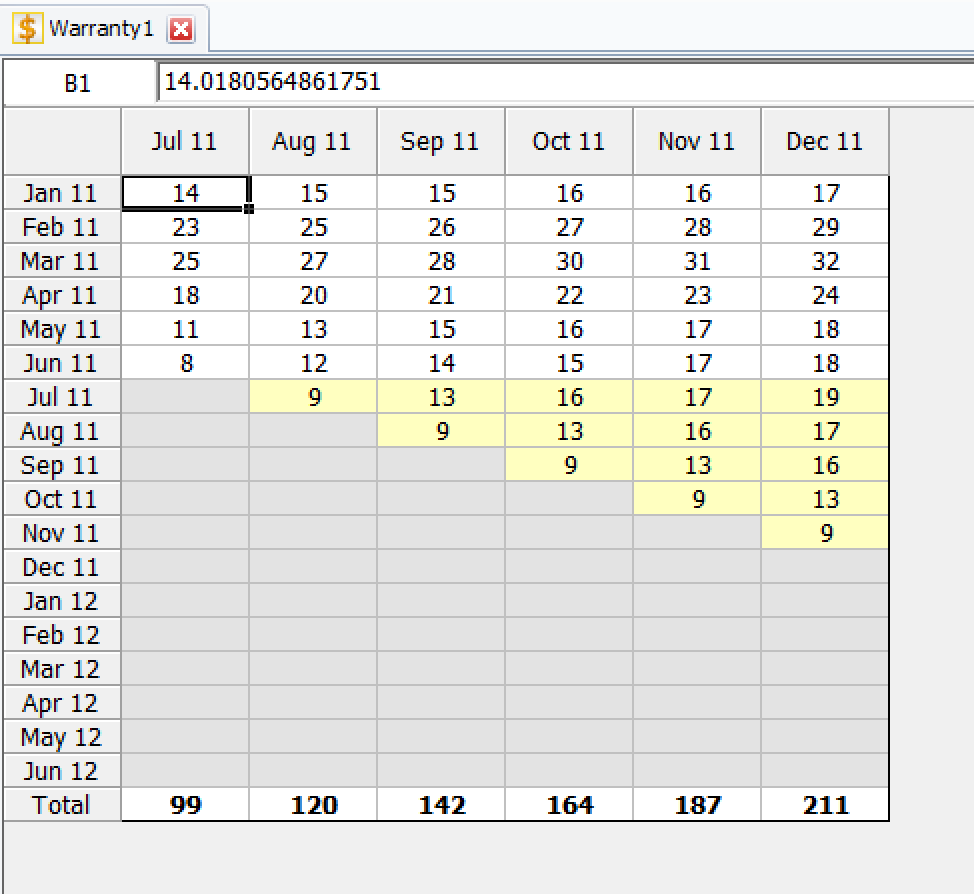
The number of returns each month is made up of returns from each month of production. Thus as units continue to ship the number of units available for failure increases. Also, if the rate of failure remains steady (not constant) as units continue to age they have an increased chance of failure.
The tally by month along the bottom of the chart provides an estimate for future expected returns. Plan accordingly.
Related:
Field Data and Reliability (article)
When to Take Action on Field Failure Data (article)
The Next Step in Your Data Analysis (article)

For the data analyzed in the example Weibull appears to be a reasonable and good fit. Given the versatility of Weibull in most situation you will realize it works for numerous data sets. I believe it is worth to mention that if Weibull distribution is not the best fit for the data then the appropriate distribution should be selected. Also if the data does not fit a 2-parameter Weibull then try the 3-parameter Weibull option. Weibull++ enables you to select the best distribution for the data.
As indicated in the article the data analyzed are from non-repairable system. I would also like to indicate if you are analyzing field data for a repairable system the Weibull analysis is used only for analyzing first failure. Otherwise you must use other methods for analyzing repairable systems and hence predict warranty information.
Thanks Lennox. I agree that Weibull is great for first failure data. For repairable systems I start with a mean cumulative function (time vs count of failures). Different articles on that one at http://fmsrel.com/1OQkwu5 and an article by Wayne Nelson at http://nomtbf.com/2012/02/graphical-analysis-of-repair-data/ of course there are other methods to describe the data well. cheers, Fred
Dear Sir,
I would like to do warranty analysis for repairable system. Please guide me to relevant resources. The above links are not working.
Thanks
Zafar
Hi Zafar,
You have a couple of options to analyze repairable system data.
First I recommend using mean cumulative function plotting – it’s straightforward and does not require any special software. You can find a introduction article by Wayne Nelson at https://accendoreliability.com/graphical-analysis-of-repair-data/
Second, if you have data related to specific failure mechanisms, then I recommend starting with Weibull analysis – search for Weibull on accendoreliability.com to find many articles, podcasts, and a few webinars that cover this topic.
You may find the series and ebook by James and myself useful too, the first of the series is at https://accendoreliability.com/using-maintenance-data-already/
Of course, there are other methods and approaches, some depending on what software packages you have available.
cheers,
Fred
Hi Fred,
Just a quick comment, if you got Eta = 123 months then ~68% of the units will fail by 10 years and not as was said “Nearly all units will fail by 10 years of use….”. In addition, it is interesting to calculate the MTTF when in this case we have Beta not equal 1.
Thx,
Hi Benjamin, you are correct if the underlying distribution is exponential. 68% fail over duration of eta. While interesting to calculate MTTF when beta is other than one, which it often is, it has little practical value.
Cheers,
Fred
Hi Fred,
I meant to Eta (characteristics life) and 63% fail over this duration for Weibull distribution with 2 parameters.
Thx,