EDITED BY JOHN HEALY
Most statistics books and the CRE Primer have tables that permit you to avoid calculating the probability for common distributions. The normal distribution requires numerical methods to conduct the calculations and would not be feasible during the CRE exam.
Thus, you should master using the various tables. One of the skills required when using these tables is the ability to interpolate. This is the calculation of the value that lies between two values in the table.
Let’s look at an example, and you most likely will recall this simple procedure.
Example Problem
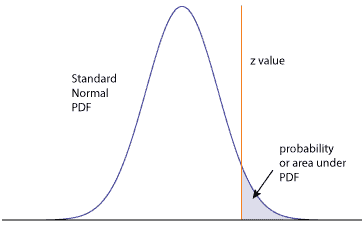
What is the probability of a value occur that is beyond 1.645 standard deviations above the mean?
First, I recommend drawing a normal PDF and shade the area representing the probability of interest. Here the z-value is the given 1.645 and falls to the right or above of the mean. This helps with using the tables, especially if the table uses a different approach to displaying the data.
The Standard Normal Table provides three significant digits. Two in the first column and the third along the top row (in most tables – I’m referring the table in the CRE Primer). Thus we can find the probability for 1.64 and for 1.65, and not 1.645.
For z of 1.64 the probability is 0.9495 and for z of 1.65, the probability is 0.9505. This implies the probability of the z of 1.645 lies somewhere between 0.9495 and 0.9505.
For interpolating we assume a straight line relationship between the z-values and probabilities. While this may not be actually true, it is often close enough to determine the value for the fourth significant digit. We can use equivalent ratios to find the desired probability.
The Interpolation Process
We have the surrounding z-values and corresponding probabilities.
Again, assuming the linear relationship will provide a good enough estimate, we can use the idea that the ratios between the differences of the lower z-value and given z-value over the difference between the lower and upper z-values, is the same as the ratio for the corresponding probabilities.
Let’s draw this out.
The ratio of the short line to the long line is the same for the z-value and the corresponding probabilities. The x represents the unknown probability we would like to determine.
The Math Involved
So let’s calculate the two ratios
$$ \large\displaystyle \begin{array}{l}\text{z-value ratio}=\frac{1.645-1.64}{1.65-1.64}=\frac{0.005}{0.01}\\\text{probability ratio}=\frac{x-0.9495}{0.9505-0.9495}=\frac{x-0.9495}{0.001}\end{array}$$
We have two ratios that are equal and one unknown, x. So set the two ratio’s as equal to each other and solve for x.
$$ \large\displaystyle \begin{array}{l}\frac{0.005}{0.01}=\frac{x-0.9495}{0.001}\\x-0.9495=\left( \frac{0.005}{0.01} \right)0.001\\x=\left( \frac{0.005}{0.01} \right)0.001+0.9495\\x=0.0005+0.9495=0.9500\end{array}$$
Just a bit of practice and this becomes a quick calculation.
Related:
Reading a Standard Normal Table (article)
z value (article)
How to read a standard normal table (article)


 Ask a question or send along a comment.
Please login to view and use the contact form.
Thanks for the description, It was really briefed in well manner.
I need suggestion for “how can I choose interpolation method based on the calculation of critical value”.
Kindly requesting you to suggest the reliable answer.
This article uses a linear interpolation – as we do not have any information to suggest other than a linear relationship between values in the table. There are other methods, and those require knowing the details of the relationship presented in the table. In my experience, if we have the formula used to create the table, and need to interpolate – I would just use the formula directly and avoid interpolation all together.
cheers,
Fred
Thanks for the description, It was really briefed in well manner.