
Using a Crow-AMSAA [Reliability Growth Analysis (RGA)] to Quantify Your Reliability Improvements (or Losses)
Part 3 of 7
This analysis enables organizations to answer many questions with relative ease. A Crow-AMSAA has many applications in a maintenance & reliability program and allows for gathering answers not available from a Weibull.
As Fred discussed in the previous post, The What & More Importantly, The Why of the Weibull Analysis can be an extremely powerful tool in your reliability toolbox.
As with all tools, a Weibull has applications that it can excel in, and those it can’t. A Crow-AMSAA excels in the fact that it can be used with mixed failure modes, something a Weibull is not good at.
What is a Crow-AMSAA?
A Crow-AMSAA analysis is a way to see how reliability is trending for a piece of equipment or even for an entire facility.
It is a plot of cumulative failures against cumulative time on a logarithmetic graph.
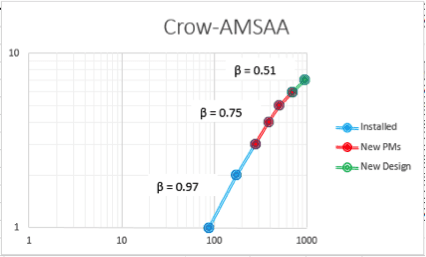
With the cumulative failures plotted against the cumulative time, a slope is generated. This slope or Beta (β) indicates the trend in reliability. It is important to note that the Beta values do not mean the same thing as in Weibull;
- Beta < 1 indicates Reliability is Improving
- Beta = 1 indicates Reliability is Static
- Beta > 1 indicates Reliability is Deteriorating
When you extend the slope you are able to see when the next failure is likely to occur based on the history of the equipment.
This is how you are able to forecast with the Crow-AMSAA. It is actually quite simple.
The failure data used for the Crow-AMSAA analysis does not have to based upon a single failure mode, but it can be. If you use a single failure mode, then you will model the reliability of the specific component, with a specific problem and a specific cause.
If you choose just to look at the equipment or system as a whole, all that is needed is the date of a failure and the cumulative time in days between the failures and you can model the reliability. Everyone has this data in their CMMS.
It is important to note that multiple slopes can be plotted in a Crow-AMSAA analysis. This is powerful when you can identify specific dates that an improvement was made (equipment redesign, procedure change, material change, etc.).
This allows you to show the impact that each of the improvements had on the operation.
When to Use a Crow-AMSAA?
A Crow-AMSAA analysis is extremely versatile and can be used for a variety of different applications;
- Planned Vs Actual: Track and trend planned vs actual reliability for a specific piece of equipment or a process. Also, predict when you will achieve your reliability goals.
- Track Reliability: Trend reliability visually with the graph, or through a trend indicator. The trend indicator could be the current Beta.
- Quantify the Cost of Unreliability: With the current reliability plotted, plot the expected (or anticipated) reliability that the equipment needs to achieve. You can see how much unreliability is costing you.
- Reliability Predictions: Use the power of the Crow-AMSAA as an early warning indicator. When you extend the slope you can anticipate the date of the next failure and work to prevent it.
- Correlation Between Improvements & Reliability: By including the different initiatives on a single plot, you can see which have the largest impact on reliability, allow you to transfer those to other pieces of equipment.
- Management Tool: The Crow-AMSAA can be used in other areas of the business as well. Think of safety. A “failure” could be a recordable incident. You can now apply this analysis to see if the safety program is actually making a difference.
I can imagine the wheels are turning now, and you are excited to try this powerful, but simple analysis. Thankfully you don’t need to have specialized software to accomplish this. You can conduct it in Excel*.
Preparing a Crow-AMSAA in Excel
Creating a Crow-AMSAA can be accomplished with specialized software, and there are some advantages to it, but there are costs associated with it. Instead, leverage the power of Excel to conduct a Crow-AMSAA analysis with these steps;
- Prepare Your Data: Prepare the failure data in a 5 column table. In column A put the failure date. Be sure to start with the birth date (when the equipment is installed, when it was overhauled, etc.). In column B you want to identify the time between each failure. Column C will be used as the X-axis of the chart, and here is where the cumulative time between failures is recorded. Column D will be used for the Y-axis of the chart, which will contain the cumulative failures. Essentially you are just putting the failure number. Lastly, in column E you can record comments for major events or changes in the equipment.
- Create an X Y Scatterplot Graph: Create an X Y scatter plot graph, using cumulative time (column C) for the X-axis and the cumulative failures for the Y-Axis. Add a title to the graph to indicate what the analysis is for.
- Convert the Axes to a Log Log: A key component of the Crow-AMSAA analysis is the fact that is based on a Logarithmetic scale. In order to change the X Y scatter plot to a Log-Log scale, you need to select each axis to access its options and check logarithmic scale with a base of 10. This must be completed for the X & Y axes.
- Add Gridlines & Trend lines: In order to accurately predict the time of the next failure or the time to reach your goal, you will need to turn the gridlines on. Click on each of the axes and add major and minor gridlines. Next, click on the data points and add a linear trendline.
- Determine Slope: This is probably the most difficult part. Since the graph is in a Log Log format, you can’t just simply measure it. Start by adding 2 columns to the table; i) Cumulative time Log; and ii) Cumulative failures Log. Using the “log10” function, convert each other cumulative failures and cumulative times to a base of Log 10. With the data in the Log 10 format, you can now use the slope function to calculate the Beta for each data set.
Please note: if you want to utilize multiple improvements or changes in a single analysis, you will have to add a new data set for each one.
Be sure to include the first and last data point for each data set. This will ensure the data is continuous in the analysis and is why we use the comment section in the original table.
You now have a completed Crow-AMSAA analysis, and can now measure & trend your reliability.
You can add some additional information to the graph such as the slope values (via a text box) or extend the lines to determine when your next failure will occur.
Use the Crow-AMSAA
Now that you have the data and the know-how, what’s stopping you from measuring the reliability of your equipment/systems?
Are you going to use the Crow-AMSAA to review impacts of your reliability improvements? By quantifying the losses and improvements you will be able to generate further support for your programs.
I remember reading that if Maintenance & Reliability professionals are doing their job, no one will notice. So use the Crow-AMSAA to share your success and quantify the improvements with dollars to ensure ongoing support for the activities.
In the next post, Fred Schenkelberg will discuss the analysis method of Mean Cumulative Plotting and how it is used to deliver benefits to your organization.
Remember, to find success, you must first solve the problem, then achieve the implementation of the solution, and finally sustain winning results.
I’m James Kovacevic
HIGH-PERFORMANCE RELIABILITY
Solve, Achieve, Sustain
All seven articles in this series in one short ebook, interested?
Please login with your site registration to download this ebook which includes all seven articles in this series.
Login
If you haven’t registered, it’s free and takes only a moment.
The other articles in the series include:
Post 1 – Using the Maintenance Data You Already Have
Post 2 – The What & More Importantly, The Why of the Weibull Analysis
Post 3 – Quantify the Improvements (or Gaps) In Your Reliability
Post 4 – First Step in Analyzing Repairable Systems Data
Post 5 – The Next Step in Your Failure Data
Post 6 – The Next Step in Your Data Analysis
Post 7 – Data Q&A with Fred & James
References:
sing a Mean Cumulative Plot
Post 5 – The Next Step in Your Failure Data
Post 6 – The Next Step in Your Data Analysis
Post 7 – Data Q&A with Fred & James
—
References:
*Excel – property of Microsoft
RGA – Reliasoft
Fred Schenkelberg- accendoreliability.com/about/fred-schenkelberg/
FMS Reliability www.fmsreliability.com
Accendo Reliability accendoreliability.com/musings/
New Weibull Handbook http://geni.us/Weibull

Thank you James
What a practical and easy-to-use breakdown of reliability growth test. It is powerful tool for self improvement. I like the use of EXCEL
Question 1
Giving the fact that RGA is based on the data (how accurate, how relevant.. ). In most cases the analysis is not the data collector or different people from different sites are involved in data collection.
What would you require and recommend for data collection for RGA purpose?
Question 2
After how long should the RGA be performed as you may not experience a failure thus nothing to record for the failure free period?
Question 3
I believe it will tedious to consider all the failure modes for the RGA. Would you recommend a kind failure modes and criticality analysis or prioritization prior to RGA?
Thank you again for sharing.
Thomas
Hi Thomas,
Using an RGA as with all analysis, requires the data to be accurate. However, the advantage to an RGA is that it can be used with mixed failures modes and does not require nearly as much data mining as a Weibull analysis for example.
For the data, having basic life data is enough to perform the analysis (birth date, death date or removal date, and failure mode). This is commonly available in your CMMS / EAM system. If the failure mode is not completely accurate, that is ok as long as you know if the failure was related to an equipment failure vs a process failure (people, materials, etc.)
I would focus the RGA on a particular piece of equipment, aimed at either process or equipment failures. The idea with an RGA is not to identify specific failure modes, but to measure the improvement in reliability after a specific action has been taken (i.e., new maintenance strategy, re-design, etc).
I hope this answered your questions. If not, just respond to this comment and I will be happy to assist further.
James
Dear James,
I’m a beginner for RGA, I just followed the details exactly the same way you described here.. what an output.. I got it very well.
many thanks!
one thing I need to clarify , how can I extend the lines to see my future failure event.
Could you please explain me in detail-“extend the lines to determine when your next failure will occur”.
imanshines@gmail.com
Hi Ismail,
You can extend the lines by continuing the current trend lines. This will allow you to see the next failure may occur.
James