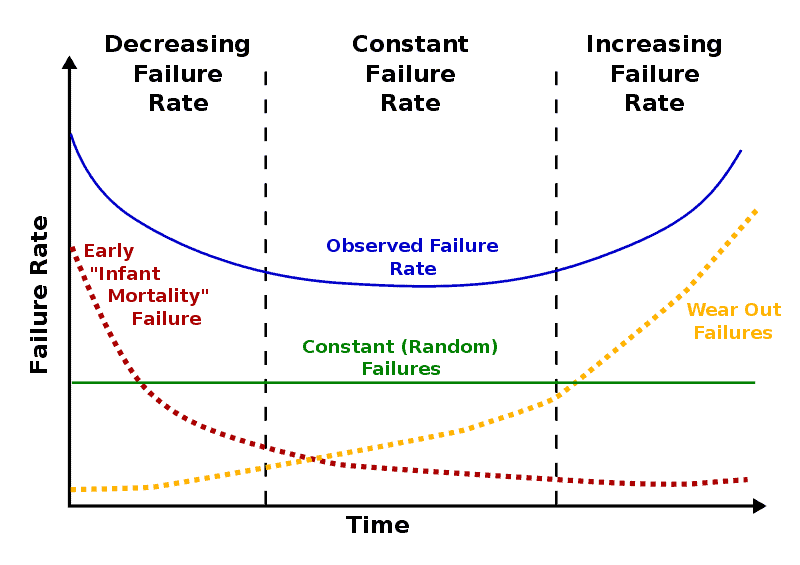
Most reliability engineers are familiar with the life cycle bathtub curve, the shape of the hazard rate or risks of failure of a electronic product over time. A typical electronic’s life cycle bathtub curve is shown in figure 1.

The origination of the curve is not clear, but it appears that it was based on the human life cycle rates of death. In human life cycles we have a high rate of death due to the risks of birth and fragility of life during that time. As we age, the rates of death decline to a steady state level until we age and our bodies start to wear out. Just as medical science has done much to extend our lives in the last century, electronic components and assemblies have also had a significant increase in expected life since the beginning of electronics when vacuum tube technologies were used. Vacuum tubes had inherent wear out failure modes that were a significant limiting factor in the life of an electronics system.
During the days of vacuum tubes, wear out of the tubes and other components were the dominant cause of field failure. Although errors in the design or manufacturing probably contributed to field failure rates, the mechanical fragility and limited life of vacuum tubes dominated the causes of system failures in a few years of use.
Traditional electronics reliability engineering and failure prediction methodology (FPM) has in its foundation the concept of the life cycle bathtub curve. The declining hazard rate region is called the “infant mortality” region. The wear out failure modes of electronics results in the increasing hazard rate represented at the “back end” of the bathtub curve. The concept of the curve has been used as a guide for “burn-in” testing and, of course, for establishing the misleading and meaningless term, MTBF.
In order to make a life prediction for an electronics assembly some assumptions must be made regarding the quality and consistency of the manufacturing process as well as assumptions on the distribution of life cycle stresses. To create models for electronics devices we must assume that the manufacturing process is capable and parts being produced are from the center of the normal distribution. We also must make assumptions about the frequency and distribution of the life cycle stresses. It is difficult to account for variations at all the manufacturing levels in models without creating significant complexity. The same applies to accounting for variation in life cycles stresses the product population will be subjected to.
Today’s electronics components, especially semiconductors, have an inherent “life entitlement” is relatively infinite relative to the technologically useful life of the system it is in. We will not likely empirically determine the life for the vast majority of electronics components and systems because technological obsolescence occurs relatively quickly. The pace of significantly better performance and features with electronics systems is not likely to slow down, and therefore the rate of technological obsolescence will not slow down. Of course there are some exceptions in electronics, such as in energy systems. Wind and solar energy systems costs justifications are based on 25 years of use.

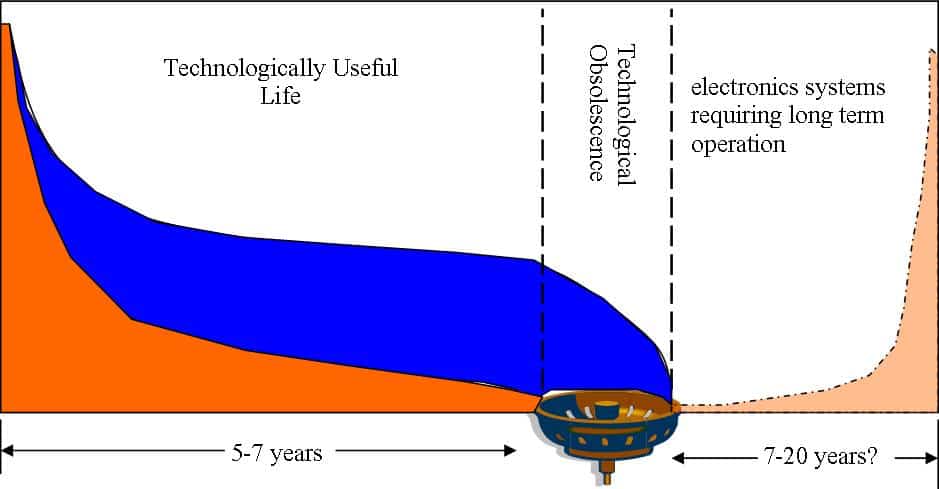
Using the same life-cycle “bathtub” curve analogy, technological obsolescence is the “drain” that is before the back end of the life cycle (wear out) mode occurs. Figure 2 is a graphical representation of the bathtub curve with the “drain”. The drain is the point in time that electronics is replaced due to technological obsolescence. Because of this technology obsolescence drain the back end of the bathtub curve a relatively small contributor to the overall costs of failure for customers and manufacturers in a very large percentage of electronics. Obsolescence is especially rapid in consumer and IT hardware. The infant mortality at the front end is where most manufacturers and customers realize the costs of poor reliability development programs and what determines future purchases for most consumers.
The causes of failures during the early production are mostly due to poor or overlooked design margins, errors in manufacturing of the components or system, or abuse (sometimes accidental). Precise data on rates and costs of product failures is not easily found, as reliability data is very confidential, but most who deal with new product introductions realize that most costs of unreliability come from the front end of the bathtub curve and not much from the wear out end of the curve. Poor reliability may result in total loss of market share in a competitive market. The backend of the bathtub curve is for the most part irrelevant in the case of high rates of failure, as an electronics company may not be in business long enough for technological obsolescence to be a factor, and even much less “wear out” failures
The electronics industry in the last few decades has been misdirected in the belief that life in an electronics system can be calculated and predicted from components rates of failures and models of some failure mechanisms (i.e. MIL HNBK 217) although there has been no empirical evidence of any correlation of most predictions to field failure rates.
The vast majority of costs of failures for almost all electronics manufacturers come in the first few years in its life, some covered by the warranty period but also a few years past that. It is the customer’s experience of reliability that determine the quality and reliability of the manufacturer and future purchases from that manufacturer. The costs of lost future sales may be even greater than warranty costs, but since is difficult to quantify it may never be known.
Most of the causes of failures are attributable to assignable causes previously mentioned. Traditional reliability engineering is mostly based on FPM and for most electronics design and manufacture companies the majority of reliability engineering resources have been spent on creating probabilistic estimates of the life entitlement of a system and the back end of the bathtub curve. There is little evidence of reducing the costs of unreliability in most electronics products because it occurs in the first several years due to assignable random causes, and not wear out.
A much greater return on investment in developing can be realized when the industry understands that most of the reliability failures in the first few years of use are not intrinsic wear out, but instead on random errors in design and during manufacturing. Reliability engineering must reorient to spend most of the reliability development time and resources to develop better accelerated stress tests, using better reliability discriminators (prognostics) to detect errors and overlook low design margins and eliminate them before market introduction. With this new orientation, electronics companies can be the most effective and quickest at developing a reliability product at market introduction at the lowest costs.
 Ask a question or send along a comment.
Please login to view and use the contact form.
Leave a Reply