Accendo Reliability

Your Reliability Engineering Professional Development Site

  • Home
  • About
    • Contributors
    • About Us
    • Colophon
    • Survey
  • Reliability.fm
    • Speaking Of Reliability
    • Rooted in Reliability: The Plant Performance Podcast
    • Quality during Design
    • CMMSradio
    • Way of the Quality Warrior
    • Critical Talks
    • Asset Performance
    • Dare to Know
    • Maintenance Disrupted
    • Metal Conversations
    • The Leadership Connection
    • Practical Reliability Podcast
    • Reliability Matters
    • Reliability it Matters
    • Maintenance Mavericks Podcast
    • Women in Maintenance
    • Accendo Reliability Webinar Series
  • Articles
    • CRE Preparation Notes
    • NoMTBF
    • on Leadership & Career
      • Advanced Engineering Culture
      • ASQR&R
      • Engineering Leadership
      • Managing in the 2000s
      • Product Development and Process Improvement
    • on Maintenance Reliability
      • Aasan Asset Management
      • AI & Predictive Maintenance
      • Asset Management in the Mining Industry
      • CMMS and Maintenance Management
      • CMMS and Reliability
      • Conscious Asset
      • EAM & CMMS
      • Everyday RCM
      • History of Maintenance Management
      • Life Cycle Asset Management
      • Maintenance and Reliability
      • Maintenance Management
      • Plant Maintenance
      • Process Plant Reliability Engineering
      • RCM Blitz®
      • ReliabilityXperience
      • Rob’s Reliability Project
      • The Intelligent Transformer Blog
      • The People Side of Maintenance
      • The Reliability Mindset
    • on Product Reliability
      • Accelerated Reliability
      • Achieving the Benefits of Reliability
      • Apex Ridge
      • Field Reliability Data Analysis
      • Metals Engineering and Product Reliability
      • Musings on Reliability and Maintenance Topics
      • Product Validation
      • Reliability by Design
      • Reliability Competence
      • Reliability Engineering Insights
      • Reliability in Emerging Technology
      • Reliability Knowledge
    • on Risk & Safety
      • CERM® Risk Insights
      • Equipment Risk and Reliability in Downhole Applications
      • Operational Risk Process Safety
    • on Systems Thinking
      • Communicating with FINESSE
      • The RCA
    • on Tools & Techniques
      • Big Data & Analytics
      • Experimental Design for NPD
      • Innovative Thinking in Reliability and Durability
      • Inside and Beyond HALT
      • Inside FMEA
      • Institute of Quality & Reliability
      • Integral Concepts
      • Learning from Failures
      • Progress in Field Reliability?
      • R for Engineering
      • Reliability Engineering Using Python
      • Reliability Reflections
      • Statistical Methods for Failure-Time Data
      • Testing 1 2 3
      • The Manufacturing Academy
  • eBooks
  • Resources
    • Accendo Authors
    • FMEA Resources
    • Glossary
    • Feed Forward Publications
    • Openings
    • Books
    • Webinar Sources
    • Journals
    • Higher Education
    • Podcasts
  • Courses
    • Your Courses
    • 14 Ways to Acquire Reliability Engineering Knowledge
    • Live Courses
      • Introduction to Reliability Engineering & Accelerated Testings Course Landing Page
      • Advanced Accelerated Testing Course Landing Page
    • Integral Concepts Courses
      • Reliability Analysis Methods Course Landing Page
      • Applied Reliability Analysis Course Landing Page
      • Statistics, Hypothesis Testing, & Regression Modeling Course Landing Page
      • Measurement System Assessment Course Landing Page
      • SPC & Process Capability Course Landing Page
      • Design of Experiments Course Landing Page
    • The Manufacturing Academy Courses
      • An Introduction to Reliability Engineering
      • Reliability Engineering Statistics
      • An Introduction to Quality Engineering
      • Quality Engineering Statistics
      • FMEA in Practice
      • Process Capability Analysis course
      • Root Cause Analysis and the 8D Corrective Action Process course
      • Return on Investment online course
    • Industrial Metallurgist Courses
    • FMEA courses Powered by The Luminous Group
      • FMEA Introduction
      • AIAG & VDA FMEA Methodology
    • Barringer Process Reliability Introduction
      • Barringer Process Reliability Introduction Course Landing Page
    • Fault Tree Analysis (FTA)
    • Foundations of RCM online course
    • Reliability Engineering for Heavy Industry
    • How to be an Online Student
    • Quondam Courses
  • Webinars
    • Upcoming Live Events
    • Accendo Reliability Webinar Series
  • Calendar
    • Call for Papers Listing
    • Upcoming Webinars
    • Webinar Calendar
  • Login
    • Member Home
Home » Articles » CRE Preparation Notes » Probability and Statistics for Reliability » Chance of Catching a Shift in a Control Chart

by Fred Schenkelberg Leave a Comment

Chance of Catching a Shift in a Control Chart

Chance of Catching a Shift in a Control Chart

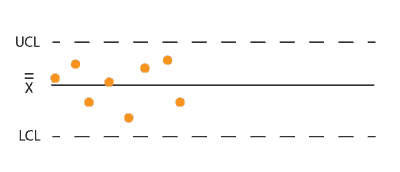
Control charts help us monitor and stabilize a process. A little graphics along with statistics provides a tool to identify when something has changed. Some changes are abrupt and obvious, other a little more subtle, yet the out of control signals each have approximately the same chance of alerting us to a change.

A little graphics along with statistics provides a tool to identify when something has changed. Some changes are abrupt and obvious, other a little more subtle, yet the out of control signals each have approximately the same chance of alerting us to a change.

What is the chance the next sample taken and plotted on a control chart will signal a change, when in fact the process has changed? We may be interested specifically if running an experiment (changing parameters, installing new equipment, trying a new material, etc.). How much change will provide an alert right away? Or what is the chance of a signal with a modest shift in the mean?

This problem takes a bit of mental gymnastics along with a solid understanding of control chart construction to solve. Let’s take a look at one way to solve this type of problem.

Currently a Stable process

Let’s say you have been using an X̄ and R control chart on your process for some time. It is stable. The center line is at 185.5 grams and the R̄ center line is at 12.3 grams. We use 5 boxes for each sample, thus n = 5.

Control-chart-shift-drawings-1

You have noticed that the average weight of the final product, 198.5 grams, is just a little below the center of the specification, 200 grams. Thus you would like to change the process to increase the resulting weight by an average of 1.5 grams while maintaining the same variation and stability.
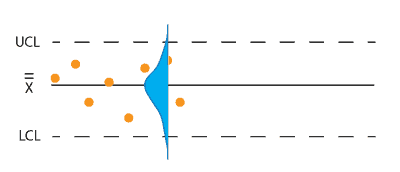
Next Monday you plan to change the process by adding a new material to the mix. You expect it to increase the average weight right away. You would also like to know if the existing control charts will detect the change. The ongoing process distribution is reflected by the blue normal curve imposed on the existing part of the chart.
Control-chart-shift-drawings-2

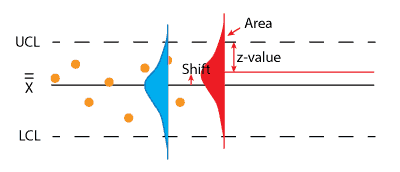
We are deliberately shifting the process up by 1.5 grams, thus shifting the normal curve up by 1.5 represented by the red curve below. What is the chance of having an out of control signal with the first sample?

Determine the control limits

In our notes we have the center line values the two charts, and didn’t note the upper control limit (UCL) value. Rather than track down that value from the chart or the supporting notes, we have enough information to calculate the UCL directly.

We need the UCL value as we want to estimate the change in the amount of the distribution that now exceeds the UCL. For the previous stable process, the UCL marked the point where we would expect an approximately 0.15% chance that a point would fall above the UCL. With the process shift, the probability is now larger.
To estimate the UCL given the X-bar and R charge center lines, recall that the formula for the UCL is

$$ \large\displaystyle UC{{L}_{{\bar{X}}}}=\bar{\bar{X}}+{{A}_{2}}\bar{R}$$

A2 is the tabulated factor to convert the average range to the UCL on the X-bar chart. With 5 measurements per sample, n = 5, and A2 = 0.58. This becomes

$$ \large\displaystyle UC{{L}_{{\bar{X}}}}=198.5+0.58\left( 12.3 \right)=205.6$$

The distance between the center line the UCL is 3 standard deviations of the averages (not the individual readings) when using 5 readings per sample. If we determine this standard error about the mean value, we can use that to determine the number z-value for the shifted process average to the old UCL.

Subtracting out the grand average from the UCL we find 205.6 – 198.5 = 7.1. And since

$$ \large\displaystyle \begin{array}{l}3{{s}_{{\bar{X}}}}={{A}_{2}}\bar{R}=7.1\\{{s}_{{\bar{X}}}}=2.37\end{array}$$

To find the z-value we want to find the distance between the new (expected) center line, 200 grams, and the former UCL, 205.6 grams divided by the sx-bar.

Control-chart-shift-drawings-3The shift up of the red curve shortens the distance between the distribution center and the UCL, thus increasing the area under the curve beyond the UCL line. The z-value is found with

$$ \large\displaystyle z=\frac{UCL-{{{\bar{\bar{X}}}}_{new}}}{{{s}_{{\bar{X}}}}}=\frac{205.6-200}{2.37}=2.36$$

Using the standard normal table in the appendix of your favorite stats book you will find the upper tail beyond a z value of 2.36 is 0.0091. Thus the probability of the first sample resulting in an out of control signal is 0.0091 or 0.91%.

This is not likely to occur as it is approximately a 1 in 100 chance, yet over time the sampling will produce enough points to detect the shift, plus to calculate the new process average and compare to the previous process values with a hypothesis test which is the subject of another article.


Related:

Variables Control Chart Background (article)

When are we out of control (article)

Special and Common Causes of Process Variation (article)


Filed Under: Articles, CRE Preparation Notes, Probability and Statistics for Reliability Tagged With: Statistical Process Control (SPC)

About Fred Schenkelberg

I am the reliability expert at FMS Reliability, a reliability engineering and management consulting firm I founded in 2004. I left Hewlett Packard (HP)’s Reliability Team, where I helped create a culture of reliability across the corporation, to assist other organizations.

« PDF to CDF with Brief Calculus Refresher
Reliability Specifications and Requirements »

Leave a Reply Cancel reply

Your email address will not be published. Required fields are marked *

CRE Preparation Notes

Article by Fred Schenkelberg

Join Accendo

Join our members-only community for full access to exclusive eBooks, webinars, training, and more.

It’s free and only takes a minute.

Get Full Site Access

Not ready to join?
Stay current on new articles, podcasts, webinars, courses and more added to the Accendo Reliability website each week.
No membership required to subscribe.

Get Weekly Email Updates
  • CRE Preparation Notes
  • CRE Prep
  • Reliability Management
  • Probability and Statistics for Reliability
  • Reliability in Design and Development
  • Reliability Modeling and Predictions
  • Reliability Testing
  • Maintainability and Availability
  • Data Collection and Use

© 2025 FMS Reliability · Privacy Policy · Terms of Service · Cookies Policy

Book the Course with John
  Ask a question or send along a comment. Please login to view and use the contact form.
This site uses cookies to give you a better experience, analyze site traffic, and gain insight to products or offers that may interest you. By continuing, you consent to the use of cookies. Learn how we use cookies, how they work, and how to set your browser preferences by reading our Cookies Policy.