
If you Google ‘fault tree analysis’ (which I know you probably haven’t), you’ll get a horrible definition that goes something like …
… a fault tree is a deductive failure analysis tool that uses Boolean logic to combine a series of lower-level events to understand the probability of a top-level system failure …
This is technically correct. Unfortunately, definitions like this don’t really help anyone. They make fault tree analysis or ‘FTA’ sound like some abstract math exercise, when in practice, fault trees are one of the most practical and human-friendly tools we have to help solve a huge range of engineering and manufacturing problems. At their core, fault trees are a way of collecting our thoughts, visualizing brainstorming sessions, and structuring messy ideas in a way that helps us make sense of what starts out as being hugely complex problems.
The Magic of AND and OR
Let’s start understanding how fault trees work by seeing how we can use them to model system reliability. At the heart of every fault tree are two types of shapes. The first type are ‘logic gates,’ while the second type are ‘basic events.’
Let’s say we have a simple system that comprises two pumps, but only one pump needs to work for the system to work. In other words, we have ‘redundancy’ in our system. The second or additional pump increases system reliability by taking over when the first pump fails. Those ‘basic events’ in our fault tree are usually circular and represent the failure of a pump. One type of ‘logic gate’ is what we call an ‘AND gate’ and is represented by a shape with a round top and flat bottom. For our two-pump system (with redundancy), the system fails when pump A fails, AND pump B fails. So the fault tree that models the reliability of this system is illustrated below.
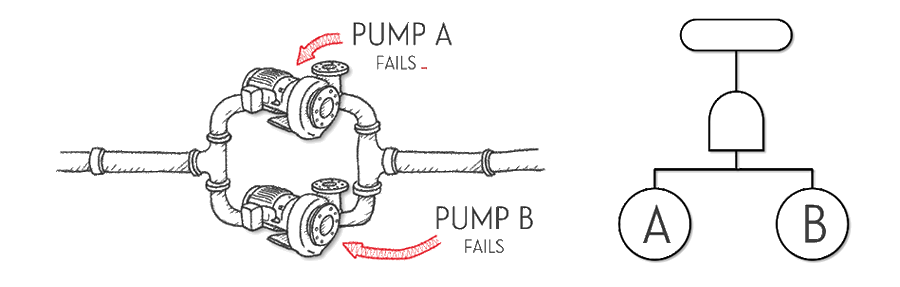
You might notice that there is another type of shape in the fault tree above, which we call the ‘top event.’ No guesses about where the name comes from, but it represents the usually ‘undesirable’ event that we are investigating. In this case, the undesirable event is ‘pump system failure.’
The type of system above is also known as a ‘parallel’ system. This is based on the layout of many redundant systems, where components, such as pumps, are installed in parallel lines, on conveyors, or on other structures to incorporate redundancy.
So the ‘AND gate’ is used when we have a scenario where the ‘top event’ happens only if all inputs happen. When these inputs are based on component failures, we can use ‘AND gates’ to model systems with redundancy, like our two-pump system, a system of batteries hooked up in parallel, or multiple conveyors.
But let’s now say we have a system that still has two pumps, but they are arranged one after the other on a pipeline … or in ‘series.’ One pump could be to pump fluid ‘up’ to a higher level, while the next pump moves the fluid somewhere else. In this system, both pumps need to work for the system to work. The system will fail if pump A fails OR pump B fails. So we use a ‘logic gate’ we call an ‘OR gate’ to model this new system as shown below.
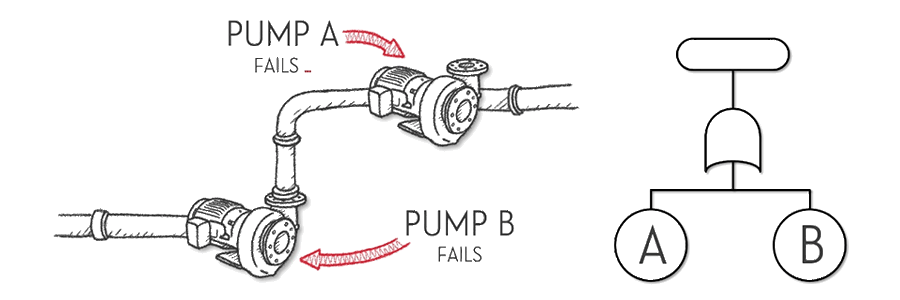
Series systems like this are all around us. Think of an old string of Christmas lights – if one bulb fails, the whole string goes dark.
Complexity and layers
What makes a fault tree powerful is the way it grows. You start with the ‘top event’ like ‘system fails to start.’ To model the reliability of this system using a fault tree, we simply peel back one layer at a time until we have gone all the way down to components. Perhaps the first layer we peel back leads us to the ‘top event’ being due to ‘battery dead’ OR ‘motor seized’ OR ‘control system error.’ If the battery is a component, then it is a basic event. If the motor is actually a subsystem that contains its own components, we peel it back one layer at a time, until we get to its components. These could be the ‘electric drive fails’ OR ‘cable breakdown’ OR ‘gear detached.’
A really simple example of a (slightly) complex system reliability model is illustrated below.
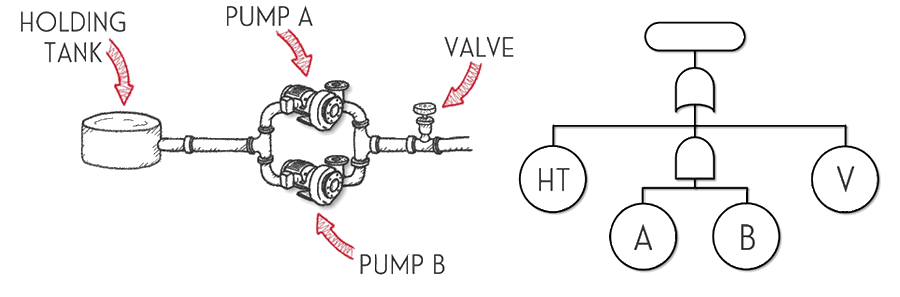
By combining these gates, we can represent the logic of how failures (or combinations of failures) cause bigger problems. Even complex systems can often be broken down into these simple AND/OR relationships.
We usually use system reliability models when we understand component reliability characteristics. These fault trees can then be used to convert those component reliability characteristics into system reliability characteristics. This can help us work out (for example) what the mission reliability of a weapon platform is, or what the ideal warranty period for our new product should be.
Switching Lenses – Root Cause Analysis
System reliability models are used to help us understand the likelihood of failure. But what happens (later on) when we have a product, system or process that has failed? If we are interested in trying to improve reliability by doing something about this failure, then we need to address its ‘root cause.’ Which brings us to ‘root cause analysis’ or ‘RCA.’
If we go back to the system reliability model fault tree, we can’t just stop at component failure. When our system fails, we usually have more context. And by that we mean information about how our system failed.
If we are trying to improve system reliability (or perhaps simply fix a failure), a ‘dead battery’ by itself might not help us fix the problem. A dead battery could be caused of ‘battery depleted’ OR ‘loose connection’ OR ‘slow current leak’ OR ‘excess draw’ to name a few. There are usually lots of potential root causes of a component failure, and we need to find them to work out what we need to do to make our battery work again.
Fault trees are great at documenting what we come up with as go down, layer by layer, as part of root cause analysis. And because they go beyond component failures, they can be quite large, like the one below.
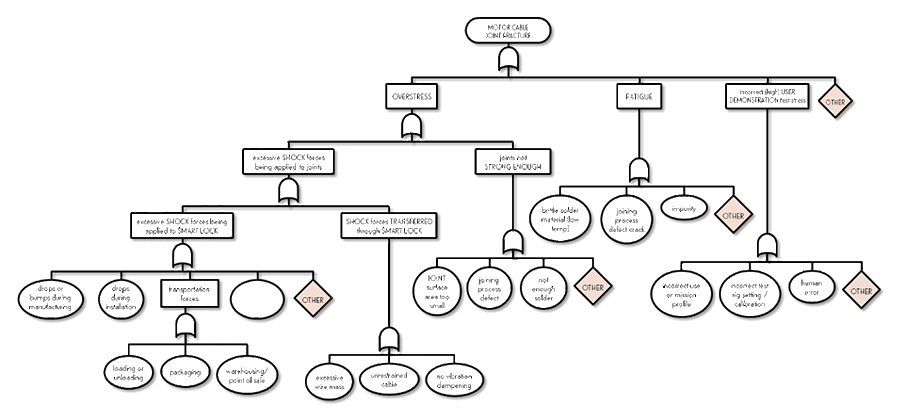
When something fails, it’s easy to rush toward our favorite explanation (like ‘it must be the supplier’s fault’ or it’s always the software’). A fault tree forces discipline. By moving one layer at a time – system, subsystem, component, part, manufacturing process, installation step and so on – we brainstorm broadly and exhaust each layer before moving further down. That prevents us from skipping straight to the causes we want to believe, and instead ensures we develop a wide, balanced list of potential root causes.
The result? A richer, more thoughtful root cause analysis that doesn’t miss the less-obvious culprits.
Two Camps, One Tool
Most people only ever see fault trees used in one of two ways:
- System reliability modeling – calculating system reliability.
- Root cause analysis – organizing and structuring brainstorming of potential root causes after a failure.
Which camp someone falls into usually depends on how they were first taught fault trees. But the truth is, fault trees are versatile enough to do both. They’re not just probability tools, and they’re not just brainstorming charts – they’re a flexible framework for thinking about failure.
We use the right tools … we don’t let the tools use us
Fault Tree Analysis is more than the dry textbook definition lets on. It’s not just Boolean logic on a page – it’s a way of organizing our messy human thought process. Whether you’re predicting system failures before they happen, or digging into the causes after something breaks, fault trees give structure, clarity, and balance.In the end, they don’t just model failures – they make us better thinkers.
 Ask a question or send along a comment.
Please login to view and use the contact form.
Ask a question or send along a comment.
Please login to view and use the contact form.
Totally agree with author’s points!
FTA help us a better thinker for the root cause analysis when the failure happens.
It is a tool, but the output depends on the person who use it.
Thanks Zeyu!