
(Originally published in Quality Magazine, October 2025)
The term Measurement Systems Analysis (MSA) refers to a collection of experimental and statistical methods designed to evaluate the error introduced by a measurement system, and the resulting usefulness of that system for a particular application. In manufacturing, measurement system quality directly affects decisions about processes, products, and a manufacturer’s ability to meet their customer’s requirements.
Measurement systems range from the simplest of gages, like steel rulers, to the most complex, multi-sensor measurement platforms. Yet regardless of their sophistication, all gages are flawed and fail to deliver a perfectly accurate result to their users. This idea is best expressed by an equation fundamental to measurement science:
Y = T + e
where:
- Y = the resulting value of the measurement process (what the gage reads)
- T = the true, typically unknown, measurement of the object under evaluation
- e = the error introduced by the measurement system
Measurement errors take many forms. Some, like instability (a slow drift over time), emerge gradually. Others, like nonlinearity (inconsistency across a gage’s range), create systematic bias. But because of their applicability to a wide range of commonly used gages, two forms of error—repeatability and reproducibility—are the most discussed and analyzed among quality engineers and calibration specialists. These errors are often evaluated together in a specialized study called Gage R&R Analysis.
Repeatability and Reproducibility
Repeatability, also known as Equipment Variation (EV), refers to the variation in measurements when the same operator uses the same gage under the same conditions repeatedly. EV is caused by issues such as friction within the gage mechanisms, dust and debris, minor design flaws, or wear in the gage components. These sources of variation result in the random dispersion of measurement values around the true measurement of the part.
Reproducibility, also known as Appraiser Variation (AV), refers to the variation in measurements when different operators use the same measurement system under similar conditions. In other words, where EV highlights differences within a single operator, AV highlights differences between operators.
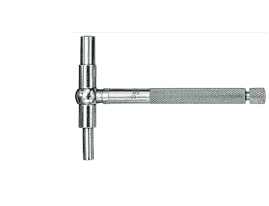
As an example, consider the telescoping bore gage shown in Figure 1. This gage is widely used in metal cutting processes, particularly for deep bore applications such as engine block cylinders. To use this gage, the operator twists open the knurled knob to release the spring-loaded rods at the T-end of the gage, allowing them to move freely. The operator then inserts the T-end into the bore at the desired depth, allowing the rounded rod ends to touch the bore wall. Once correctly positioned, the operator twists the knurled knob to lock the rods into place, removes the gage from the bore, and measures the locked rod distance with micrometers or a similar instrument.
Each step in this process—positioning the gage, locking the rods, removing the tool, measuring with a micrometer—introduces another source of variation between operators. Compounded together, these differences form AV.
Two Methods of Gage R&R Analysis
Gage R&R Analysis is performed using one of two major methods: the Average and Range (A&R) method and the ANOVA method. Most fill-in-the-blank Excel-based Gage R&R templates rely on the simpler A&R method, which is also easier for quality professionals to learn because of its similarities to traditional control charting.
The study design, regardless of the subsequent analysis method, involves selecting the number of parts, number of operators, and number of measurements per part. For instance, a 10×3×3 study requires 10 parts × 3 operators × 3 measurements per part, for a total of 90 measurements.
From these data, the study facilitator calculates averages and ranges that reflect differences between parts, between trials, and between operators. These differences are then converted into estimates of standard deviation using statistical constants called K factors.
For example, the A&R method requires calculating the range of measured values for each appraiser-part combination. In the 10×3×3 study, this produces 30 ranges. The grand average of those range values (called R-bar) equates to the average dispersion of measurement values despite measuring the same parts with the same gage. Using a K factor called K1, R-bar is converted into EV, an estimate of the standard deviation of repeatability error. A similar approach is used to calculate AV, the estimated standard deviation of the reproducibility error. Through vector addition, EV and AV combine to form Total R&R, an estimate of the error portion of the total gage output.
The ANOVA Method
While the Average and Range method offers simplicity, the ANOVA method provides more insight. This more complex approach offers an advantage by separating and quantifying the individual sources of variation with greater precision. Instead of relying on ranges and conversion factors, ANOVA uses the analysis of variance statistical technique to directly partition the total measurement variation into components attributable to parts, operators, and their interactions.
This allows practitioners not only to estimate EV and AV with greater accuracy, but also to identify whether significant part-operator interaction effects exist—an insight the A&R method cannot provide. For example, if one operator consistently measures a particular part larger or smaller than the other operators, the ANOVA method can detect this interaction and flag it as a meaningful contributor to overall variation. On the other hand, if all operators measure parts consistently, ANOVA confirms that no significant interaction exists.
In practice, the ANOVA method involves calculating sums of squares for each source of variation, dividing by the appropriate degrees of freedom to obtain mean squares, and then using F-tests to evaluate statistical significance. While the calculations are more involved, the result is a richer understanding of the measurement system’s behavior. In short, ANOVA not only quantifies variation, it helps pinpoint its source.
Why It Matters
Regardless of the chosen method, recognizing that the output of a gage is only a “partial truth” is the key to understanding the importance of measurement system analysis. By acknowledging and quantifying the inherent variability in any measurement system, quality professionals can make informed decisions, improve processes, and ensure that data-driven insights lead to meaningful actions.
Ultimately, the goal is not just to evaluate the gage but to ensure that capability studies, SPC charts, and process improvement projects are built on reliable data. Only then can organizations have confidence that the numbers driving business and engineering decisions truly reflect reality.
Ray Harkins is the General Manager of Lexington Technologies in Lexington, North Carolina. He earned his Master of Science from Rochester Institute of Technology and his Master of Business Administration from Youngstown State University. He also taught over 120,000 student quality-related skills such as Reliability Engineering Statistics, An Introduction to Reliability Engineering, Quality Engineering Statistics, An Introduction to Quality Engineering, Root Cause Analysis and the 8D Corrective Action Process, Process Capability Analysis, and Return on Investment Analysis for Manufacturing through the online learning platform, Udemy. He can be reached via LinkedIn at linkedin.com/in/ray-harkins or by email at the.mfg.acad@gmail.com.

Leave a Reply