Introduction
The prior article, MSA 3: Gage Bias, focused on defining and calculating a point estimate of gage bias. A method was presented to determine if the bias was statistically significant. If significant, the bias would be applied to the data as a correction factor.
This article discusses gage bias linearity over a measurement range.
Linearity
For this article, the it is assumed that a gage is used to measure a physical dimension of production parts in a manufacturing operation. The gage is collecting data over a relatively range of measurements. After an initial bias study, it may be assumed that the bias is constant. To verify that assumption a linearity study should be conducted.
The gage bias needs to be established at the data extremes and several intermediate values. Reference standards, such as gage blocks, may not exist for a specific study. However, production parts can be converted into reference standards for the linearity study.
First, a feature would be measured on production parts. Parts with the minimum, the maximum, and several intermediate measurements are selected. These parts would be re-measured in a laboratory or on a flat plate inspection station. Once the feature dimensions are established, the parts are considered reference standards.
The MSA (Measurement Systems Analysis Manual, 4thEdition) recommends a gage linearity study requires
- A minimum of 5 parts selected to span the operating range.
- Each part would be measured to determine its reference value.
- Each part would be measured at least 10 times by the operator who would normally use the gage.
- The part measurement order would be randomized.
The linearity study is conducted and the measurements recorded for analysis.
The Data
The statistical analysis of the measurements is rather complex, and if done manually, is error prone. But this analysis is supported by commercially available software. Minitab was used to analyze the measurement data as it supports a diverse range of graphs and statistical analysis tools. Minitab has a windows style drop down menu interface that most users will find familiar.
Following the MSA linearity guidelines, 5 parts were selected and randomly measured 10 times. there was a randomized list of 50 measurement values x associated with a part number and a reference value x0.
A good analysis consists of viewing the measurements graphically and then calculating the statistics. The measurement pattern should drive the statistical analysis. Without understanding the data pattern, it would be easy to calculate misleading statistics.
In our example, a plot of the measurements vs the references are shown in figure 1.
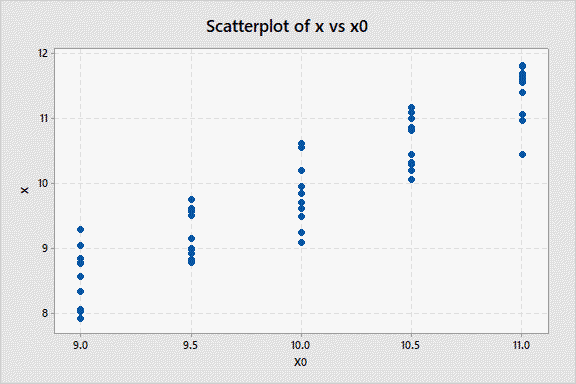
Figure 1
This plot of measurement y vs the reference x0shows a positive linear trend. This suggest using a linear regression plot, figure 2.
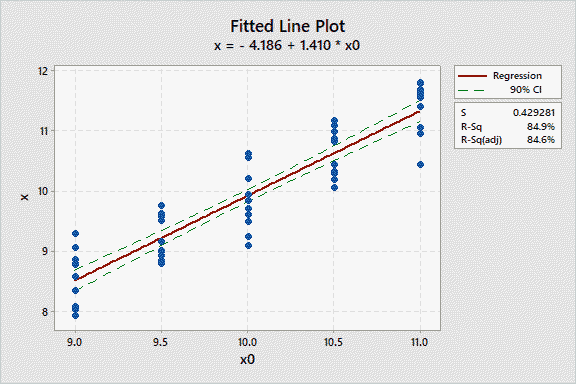
Figure 2
Both figure 1 and 2 both show a lot of data scatter at each reference value. Figure 2 shows the regression line has an R2= 84.9%. This means a linear regression model explains 84.9% of the variation in the data. Still, it remains to be determined if the regression model is statistically significant? An analysis of variance on the regression is provided in table 1.
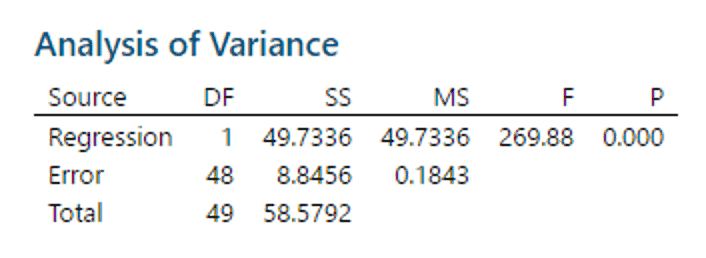
Table 1
This table shows the regression has a P=0. The probability of the data following the linear model by chance is almost 0. So, the regression is significant.
Bias
While the linear trend in the measurement data is important, the primary objective of the study is to determine the bias. In figure 2, the best fit line shows that bias=-0.5 at the reference value of 9. At the reference value of 11, the bias=+0.2.
The bias for individual measurements is calculated using . A regression plot of bias vs x0is shown in figure 3.
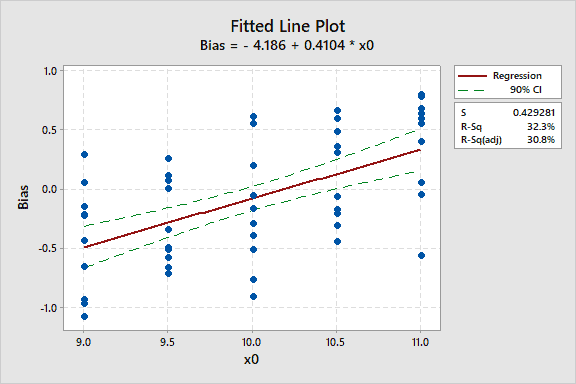
Figure 3
Figure 3 shows a linear relation between the bias and the reference value %-x_0-%. The bias values show scatter about the best fit line. Is the regression significant? The ANOVA table shows
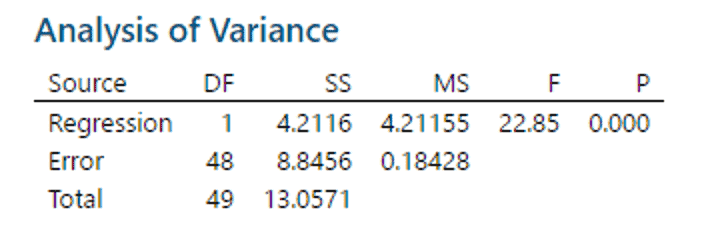
Table 2
Again, the P-value for the regression is significant, so bias linearity is important.
Gage Linearity and Bias Study
The Minitab dialog box “Gage Linearity and Bias Study” combines the analysis process into one operation to analyze gage linearity. It is accessed with a windows style pull-down menu.
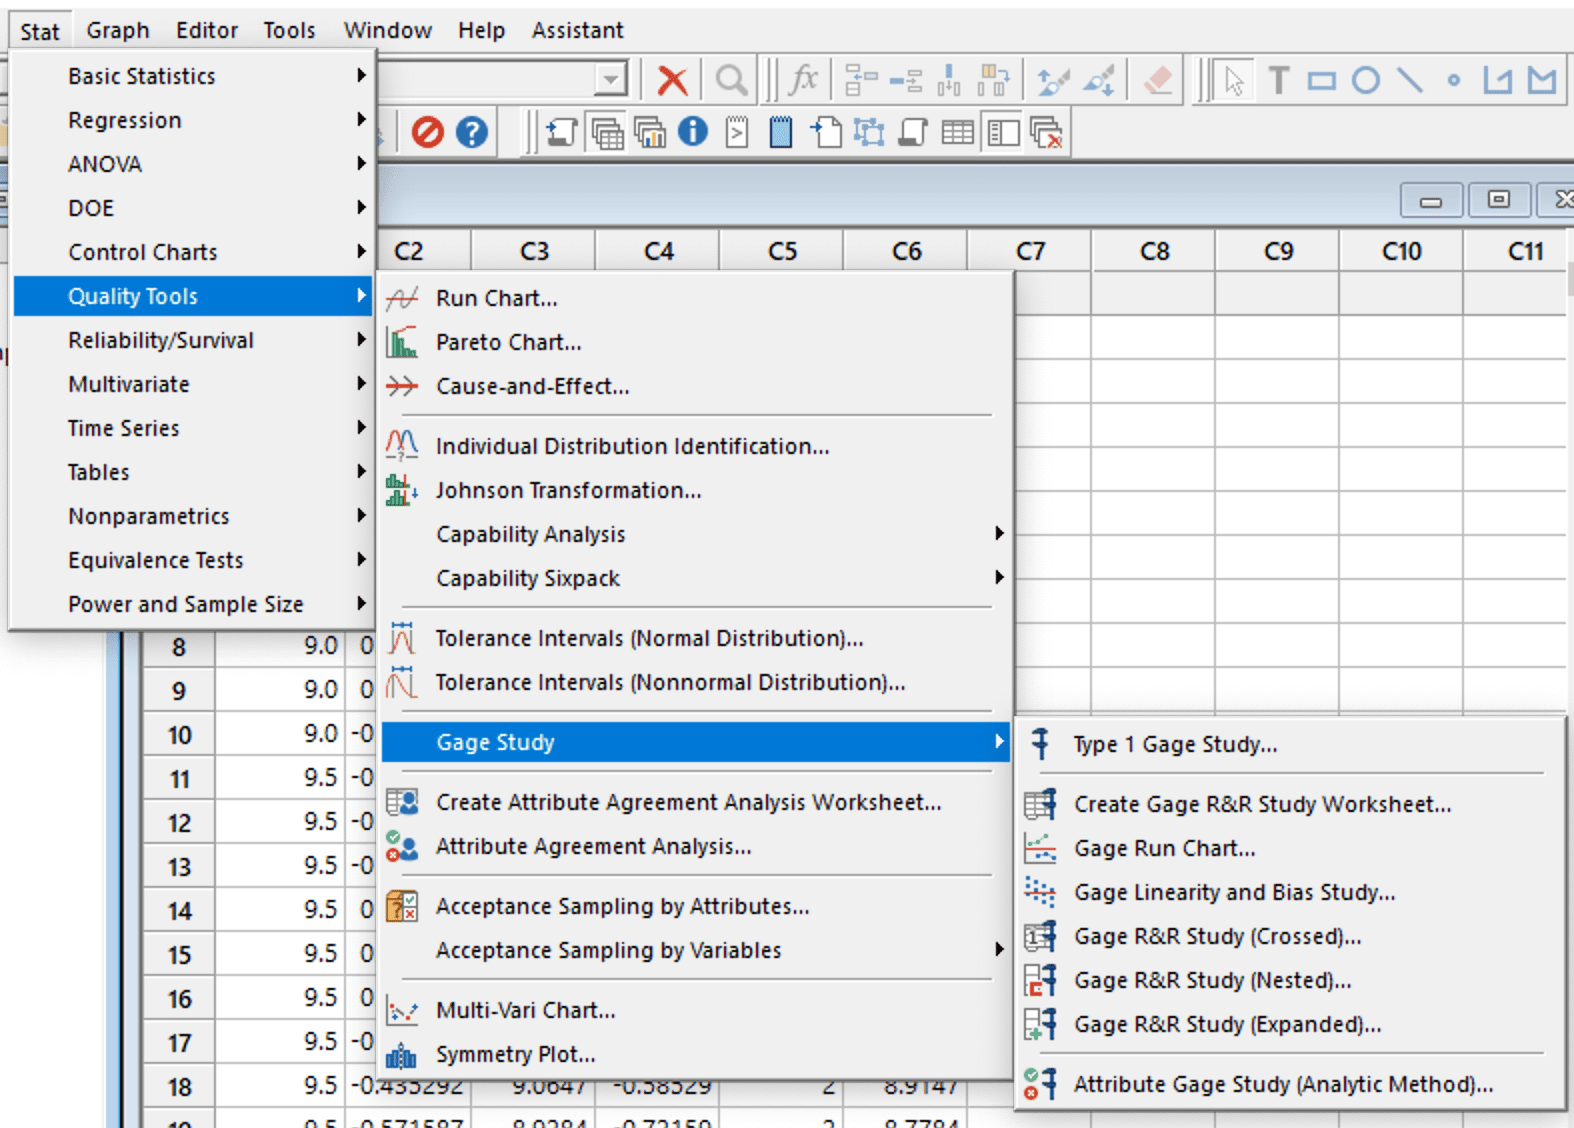
Figure 4
The dialog box contains fields need to be completed to tell the software which data to analyze, figure 5.
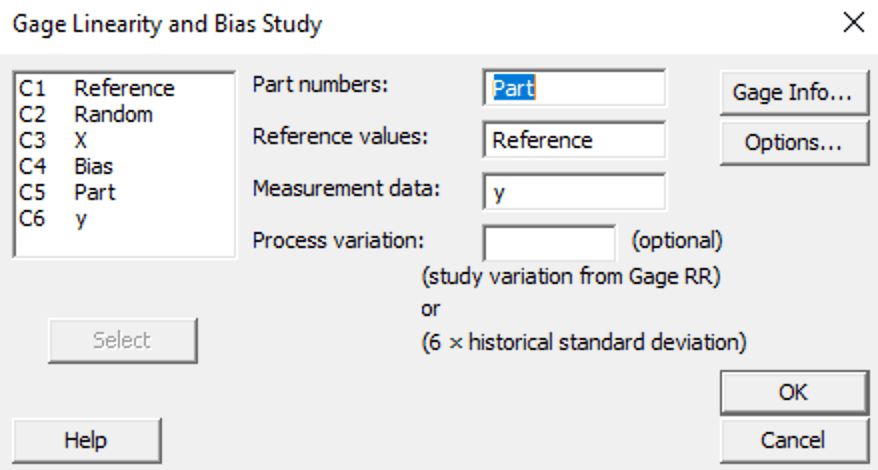
Figure 5
The named columns that contain data are shown in the box to the upper left. The part number, reference value, and the measurement data are required inputs. The bias calculation for individual measurements is done within the software. Click on the OK button to produce the linearity report, figure 6.
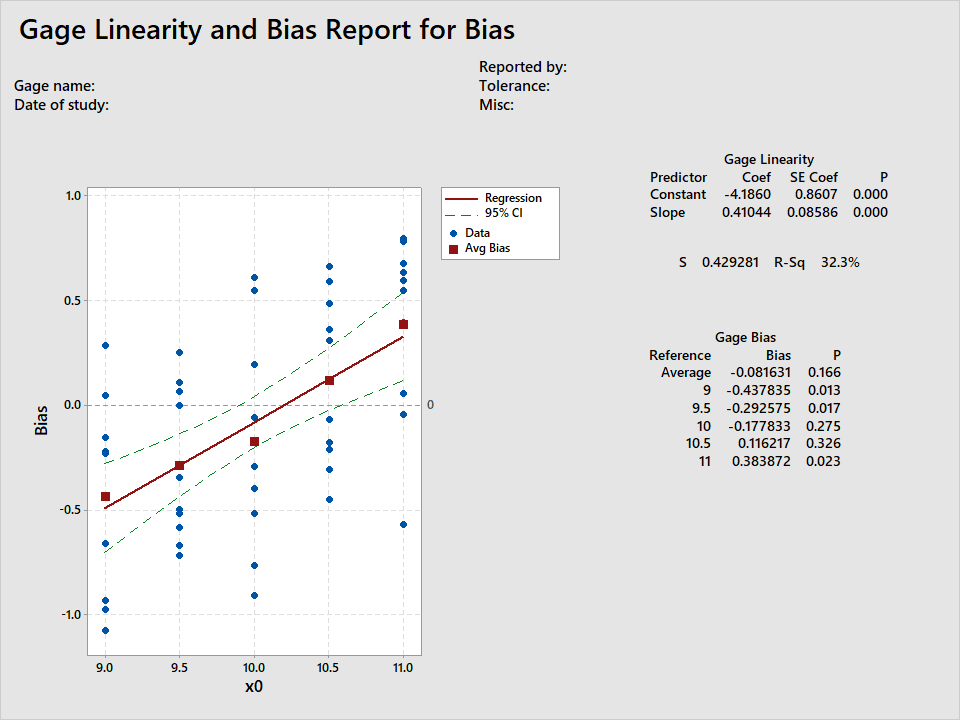
Figure 6
This graphic summarizes several analyses:
- A fitted line plot of the Bias vs x0, the reference standards.
- ANOVA of the gage linearity. For the slope and constant (intercept) the p-values of 0 shows the linear regression was significant.
- A residual standard deviation 0.429 remains after regression.
- The correlation of 32.2% shows the bias regression explains 32.2% of the variation in the bias.
- Gage Bias results for different reference standards.
Conclusion
In this example, one would be justified to apply a variable gage bias correction factor.
Note
If you want to engage me on this or other topics, please contact me. We can discuss your problem/concerns and determine how I can help solve your analysis, design, and manufacturing problems.
I have worked in Quality, Reliability, Applied Statistics, and Data Analytics for over 30 years in design engineering and manufacturing. At Wayne State University, I taught at the graduate level. I also provided Minitab seminars to corporate clients, write articles, and have presented and written papers at SAE, ISSAT, and ASQ.
Dennis Craggs, Consultant
Quality, Reliability and Analytics Services
dlcraggs@me.com
(810) 964-1529

Hi, I have one query.
Is linearity and bias will required perform before conduct the Gage R&R study.
Or there is no relation we can directly start performing the Gage R and R study
It does not take long to conduct a GR&R study. This provides information of the gage bias and %GRR. If the gage is marginal (%GRR>30%), then your focus should be to improve the measurements. This may require a newer gage, a different type of gage, operator training, or other improvements.
If the gage is dedicated to measure one product feature, you may feel that a linearity study isn’t required. However, just to be complete, one may repeat the GRR study spanning the tolerance extremes.
If there are multiple uses for the gage, then conduct a linearity study over the range of potential applications. This should provide enough information about gage bias and %GRR over the operating range. Then, you will know the bias adjustment to use for different measurement situations. If the %GRR degrades near the end of the measurement range, it may indicate limits on the gage capability.
I hope this helps. If you have more questions, just ask.
Hi, I have one query.
What MSA Study can we perform on our IMTE?
Is it required for all to conduct Linearity, Stability, Bias and GRR?
Hope you can answer my question.
Thanks.
I need to know more to answer your question. What is an IMTE?
Hi Daryl,
I am revisiting questions that have not been fully answered. I found IMTE is an abbreviation for Inspection Measurement and Test Equipment.
GR&R should be applicable for IMTE. You probably should conduct GR&R studies to partition Total Variation into Part Variation, Appraiser Variation, Equipment Variation, and Residual Variation. Equipment Variation would be directly related to IMTE. Anything that reduces Equipment Variation should be of interest to you. It could be design, manufacturing, assembly, setup, and operation. For instance, defining correct setup procedures would be paramount. Specifying calibration and maintenance could maintain IMTE performance. To reduce Appraiser Variation, consider operator training and certification. Work with your customers to identify if there are failure modes associated with the equipment.
I hope this helps.
Hi sir
What is the acceptance criteria for linearty in MSA.
Mr. Kumar, I apologize for not responding to your question. At the time, my was getting out of a 7 week hospitalization, 5 of which were in intensive care. The issues have continued, so I haven’t prioritize any professional work.
With regard to linearity, a lot of the criteria should be determined by the analyst. One could create a residuals plot to see if there are non-normal patterns. Of course, this is a subjective analysis that is highly dependent on the skill of the analyst. Alternatively, use an ANOVA table of the test data to determine how much of the variation is explained by a linear model. If a linear model explains a high percentage of the variation, at least 90%, and the statistical significance is better than 0.1, then it probably is linear.
So combine graphical and mathematical analysis to assess linearity.
Dennis Craggs (810)964-1529