Accendo Reliability

Your Reliability Engineering Professional Development Site

  • Home
  • About
    • Contributors
  • Reliability.fm
    • Speaking Of Reliability
    • Rooted in Reliability: The Plant Performance Podcast
    • Quality during Design
    • Critical Talks
    • Dare to Know
    • Maintenance Disrupted
    • Metal Conversations
    • The Leadership Connection
    • Practical Reliability Podcast
    • Reliability Matters
    • Reliability it Matters
    • Maintenance Mavericks Podcast
    • Women in Maintenance
    • Accendo Reliability Webinar Series
    • Asset Reliability @ Work
  • Articles
    • CRE Preparation Notes
    • on Leadership & Career
      • Advanced Engineering Culture
      • Engineering Leadership
      • Managing in the 2000s
      • Product Development and Process Improvement
    • on Maintenance Reliability
      • Aasan Asset Management
      • CMMS and Reliability
      • Conscious Asset
      • EAM & CMMS
      • Everyday RCM
      • History of Maintenance Management
      • Life Cycle Asset Management
      • Maintenance and Reliability
      • Maintenance Management
      • Plant Maintenance
      • Process Plant Reliability Engineering
      • ReliabilityXperience
      • RCM Blitz®
      • Rob’s Reliability Project
      • The Intelligent Transformer Blog
    • on Product Reliability
      • Accelerated Reliability
      • Achieving the Benefits of Reliability
      • Apex Ridge
      • Metals Engineering and Product Reliability
      • Musings on Reliability and Maintenance Topics
      • Product Validation
      • Reliability Engineering Insights
      • Reliability in Emerging Technology
    • on Risk & Safety
      • CERM® Risk Insights
      • Equipment Risk and Reliability in Downhole Applications
      • Operational Risk Process Safety
    • on Systems Thinking
      • Communicating with FINESSE
      • The RCA
    • on Tools & Techniques
      • Big Data & Analytics
      • Experimental Design for NPD
      • Innovative Thinking in Reliability and Durability
      • Inside and Beyond HALT
      • Inside FMEA
      • Integral Concepts
      • Learning from Failures
      • Progress in Field Reliability?
      • Reliability Engineering Using Python
      • Reliability Reflections
      • Testing 1 2 3
      • The Manufacturing Academy
  • eBooks
  • Resources
    • Accendo Authors
    • FMEA Resources
    • Feed Forward Publications
    • Openings
    • Books
    • Webinars
    • Journals
    • Higher Education
    • Podcasts
  • Courses
    • 14 Ways to Acquire Reliability Engineering Knowledge
    • Reliability Analysis Methods online course
    • Measurement System Assessment
    • SPC-Process Capability Course
    • Design of Experiments
    • Foundations of RCM online course
    • Quality during Design Journey
    • Reliability Engineering Statistics
    • Quality Engineering Statistics
    • An Introduction to Reliability Engineering
    • An Introduction to Quality Engineering
    • Process Capability Analysis course
    • Root Cause Analysis and the 8D Corrective Action Process course
    • Return on Investment online course
    • CRE Preparation Online Course
    • Quondam Courses
  • Webinars
    • Upcoming Live Events
  • Calendar
    • Call for Papers Listing
    • Upcoming Webinars
    • Webinar Calendar
  • Login
    • Member Home

by Dennis Craggs Leave a Comment

MSA 5 – Gage Stability

Introduction

The gage measurements are expected to be stable, meaning the gage should provide consistent readings. Some random variation due to random error is expected. However, gage measurements change with time or because the gage is damaged. The gage stability can be checked by measuring a known reference.

In this article, it is shown how to use control charts to assess gage stability.

Definitions

The stability can be viewed as a combination of the bias and repeatability demonstrated with repeat measurements of a known characteristic on a reference part.

  • Bias is defined as the difference between the measurement and the actual value being measured.
  • Repeatability is the variation in measurements seen when measuring the same characteristic on the same part with the same gage.

Variation

Repeated measurements always show variation and may be attributed to common causes.  But special causes may be present that inflate the variation. Some examples of special causes are:

  • A gage is subject to temperature changes.
  • A new person is collecting measurements.
  • A gage ages, is worn, or is damaged.
  • Supply voltage for electronic sensors (gages) change.

Gages must be checked periodically to determine if they are still acceptable. The gage records should be retained for analysis and compared to the current gage bias and repeatability.

Stability Study Guidelines

The MSA manual provides guidelines for conducting a stability study as follows:

  1. Create a master part with a known reference value for a characteristic. This is accomplished by measuring the value on production parts. Then select a part whose value is near the process mean. Use a measurement lab to determine the actual reference value. This master part will be repeatedly measured to eliminate part variation.
  2. Collect data for about 20 data subgroups of 3 to 5 repeated measurements of the reference part. This amount of data should be sufficient for the study. The subgroups should be separated by time intervals, perhaps a day or week.
  3. Create control charts of the data to analyze the mean and variation. Xbar and R charts (or S charts) are recommended.
  4. Analyze the control charts to determine if the measurements are in statistical control using the Western Electric Run Rules.

Run rules provide a way to look for non-random patterns in control charts that are produced by special causes of variation. If the control chart shows special causes are present, then more advanced multivariate studies may be required to identify the special causes. For example, a GR&Rstudy, which is based on DOE concepts, can quantify the variation due to appraiser, part, and repeatability.

Control Charts of the Measurements

For this example, the MSA Reference Manual 4thedition, chapter III, section B, recommendations for a stability study were followed. There were 20 groups of 5 repeated measurements of the same part dimension. Minitab was used to display the measurements on a combined -bar and R-chart.
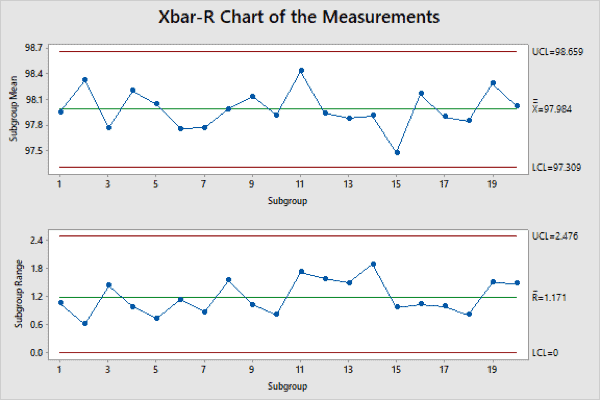
Figure 1

In figure 1, the top chart of sample means is the X-bar chart and the lower chart of sample ranges range is the R Chart. The x-axis shows subgroup numbers. On the X-bar chart, each data point represents the average of the 5 samples of a subgroup. On the R Chart, each data point represents the range of the 5 samples of a subgroup.

In this example, the Minitab software checked all the run rules, and the measurements showed no evidence of special causes. The measurements appear to be stable, subject to only common causes.

The control charts of the measurements in figure 1 followed the example in the MSA manual. By charting the measurements, the analysis focused on the part. However, performing the analysis on the bias focuses on the gage, not the part being measured.

If the master part was damaged or lost, then a new master part would have to be created. It would have a different reference value. The X-bar chart would have two different average values, one for the original master and one for the new master.

It would be easier to analyze the gage bias with a control chart. If the original and new masters had close reference values, the gage bias should be similar. A single X-bar chart could be used.

Control Chart of the Bias

The bias values for each measurement are calculated by subtracting the master part reference value from the measurement data. This topic was discussed in MSA 3 Gage Bias

$$Bias = Measurement Value – Reference Value$$

The bias control charts using the data for figure 1 yielded,
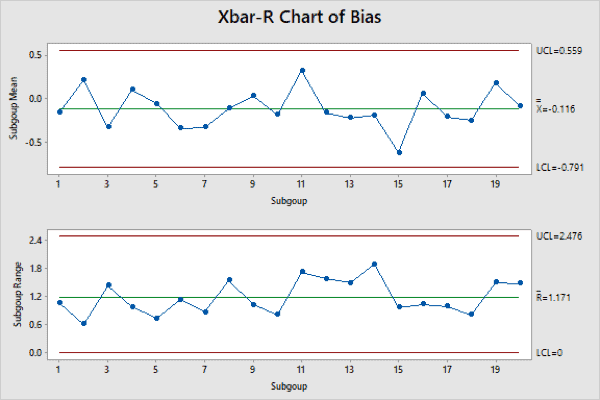
Figure 2

The X-bar chart of figure 2 is almost identical to that in figure 1, except for y-axis scale. Again, the run rules were all considered, and the bias control chart shows no evidence of special causes. The gage is stable.

Conclusion

A stability study focuses on gage bias.

  • The study uses repeated measurements of a master part reference value.
  • Measurements are collected in subgroups of 3-5 repeated measurements by an operator. The subgroups are collected in a systematic pattern, perhaps one for each shift or at weekly intervals.
  • Bias is calculated for each measurement.
  • The bias subgroups are plotted on X-bar and R charts.
  • If the control charts don’t show any special causes, then the gage is stable.

Note

If you want to engage me on this or other topics, please contact me. We can discuss your problem/concerns and determine how I can help solve your analysis, design, and manufacturing problems.

I have worked in Quality, Reliability, Applied Statistics, and Data Analytics for over 30 years in design engineering and manufacturing. At Wayne State University, I taught at the graduate level. I also provided Minitab seminars to corporate clients, write articles, and have presented and written papers at SAE, ISSAT, and ASQ.

Dennis Craggs, Consultant
Quality, Reliability and Analytics Services
dlcraggs@me.com
(810) 964-1529

Filed Under: Articles, Big Data & Analytics, on Tools & Techniques

« Dual-Ring Network Reliability
The key to Reliable Equipment is the same as the secret to a happy marriage! »

Leave a Reply Cancel reply

Your email address will not be published. Required fields are marked *

The Accendo Reliablity logo of a sun face in circuit

Please login to have full access.


Lost Password? Click here to have it emailed to you.

Not already a member? It's free and takes only a moment to create an account with your email only.

Join

Your membership brings you all these free resources:

  • Live, monthly reliability webinars & recordings
  • eBooks: Finding Value and Reliability Maturity
  • How To articles & insights
  • Podcasts & additional information within podcast show notes
  • Podcast suggestion box to send us a question or topic for a future episode
  • Course (some with a fee)
  • Largest reliability events calendar
  • Course on a range of topics - coming soon
  • Master reliability classes - coming soon
  • Basic tutorial articles - coming soon
  • With more in the works just for members
Speaking of Reliability podcast logo

Subscribe and enjoy every episode

RSS
iTunes
Stitcher

Join Accendo

Receive information and updates about podcasts and many other resources offered by Accendo Reliability by becoming a member.

It’s free and only takes a minute.

Join Today

Dare to Know podcast logo

Subscribe and enjoy every episode

RSS
iTunes
Stitcher

Join Accendo

Receive information and updates about podcasts and many other resources offered by Accendo Reliability by becoming a member.

It’s free and only takes a minute.

Join Today

Accendo Reliability Webinar Series podcast logo

Subscribe and enjoy every episode

RSS
iTunes
Stitcher

Join Accendo

Receive information and updates about podcasts and many other resources offered by Accendo Reliability by becoming a member.

It’s free and only takes a minute.

Join Today

Recent Articles

  • So, What’s Still Wrong with Maintenance
  • Foundation of Great Project Outcomes – Structures
  • What is the Difference Between Quality Assurance and Quality Control?
  • Covariance of the Kaplan-Meier Estimators?
  • Use Of RFID In Process Safety: Track Hazardous Chemicals And Track Personnel

© 2023 FMS Reliability · Privacy Policy · Terms of Service · Cookies Policy

This site uses cookies to give you a better experience, analyze site traffic, and gain insight to products or offers that may interest you. By continuing, you consent to the use of cookies. Learn how we use cookies, how they work, and how to set your browser preferences by reading our Cookies Policy.