Accendo Reliability

Your Reliability Engineering Professional Development Site

  • Home
  • About
    • Contributors
  • Reliability.fm
    • Speaking Of Reliability
    • Rooted in Reliability: The Plant Performance Podcast
    • Quality during Design
    • Critical Talks
    • Dare to Know
    • Maintenance Disrupted
    • Metal Conversations
    • The Leadership Connection
    • Practical Reliability Podcast
    • Reliability Matters
    • Reliability it Matters
    • Maintenance Mavericks Podcast
    • Women in Maintenance
    • Accendo Reliability Webinar Series
    • Asset Reliability @ Work
  • Articles
    • CRE Preparation Notes
    • on Leadership & Career
      • Advanced Engineering Culture
      • Engineering Leadership
      • Managing in the 2000s
      • Product Development and Process Improvement
    • on Maintenance Reliability
      • Aasan Asset Management
      • CMMS and Reliability
      • Conscious Asset
      • EAM & CMMS
      • Everyday RCM
      • History of Maintenance Management
      • Life Cycle Asset Management
      • Maintenance and Reliability
      • Maintenance Management
      • Plant Maintenance
      • Process Plant Reliability Engineering
      • ReliabilityXperience
      • RCM Blitz®
      • Rob’s Reliability Project
      • The Intelligent Transformer Blog
    • on Product Reliability
      • Accelerated Reliability
      • Achieving the Benefits of Reliability
      • Apex Ridge
      • Metals Engineering and Product Reliability
      • Musings on Reliability and Maintenance Topics
      • Product Validation
      • Reliability Engineering Insights
      • Reliability in Emerging Technology
    • on Risk & Safety
      • CERM® Risk Insights
      • Equipment Risk and Reliability in Downhole Applications
      • Operational Risk Process Safety
    • on Systems Thinking
      • Communicating with FINESSE
      • The RCA
    • on Tools & Techniques
      • Big Data & Analytics
      • Experimental Design for NPD
      • Innovative Thinking in Reliability and Durability
      • Inside and Beyond HALT
      • Inside FMEA
      • Integral Concepts
      • Learning from Failures
      • Progress in Field Reliability?
      • Reliability Engineering Using Python
      • Reliability Reflections
      • Testing 1 2 3
      • The Manufacturing Academy
  • eBooks
  • Resources
    • Accendo Authors
    • FMEA Resources
    • Feed Forward Publications
    • Openings
    • Books
    • Webinars
    • Journals
    • Higher Education
    • Podcasts
  • Courses
    • 14 Ways to Acquire Reliability Engineering Knowledge
    • Reliability Analysis Methods online course
    • Measurement System Assessment
    • SPC-Process Capability Course
    • Design of Experiments
    • Foundations of RCM online course
    • Quality during Design Journey
    • Reliability Engineering Statistics
    • Quality Engineering Statistics
    • An Introduction to Reliability Engineering
    • An Introduction to Quality Engineering
    • Process Capability Analysis course
    • Root Cause Analysis and the 8D Corrective Action Process course
    • Return on Investment online course
    • CRE Preparation Online Course
    • Quondam Courses
  • Webinars
    • Upcoming Live Events
  • Calendar
    • Call for Papers Listing
    • Upcoming Webinars
    • Webinar Calendar
  • Login
    • Member Home

by Dennis Craggs Leave a Comment

MSA 3 – Gage Bias

MSA 3 – Gage Bias

Introduction

In my prior article, Measurement Systems, the total variation in the measurement data was partitioned into part variation (PV), assessor variation (AV), and equipment variation (EV). GR&R is the square root of the sum of the squares of AV and EV. If the ratio of GRR/TV is less than 10%, then the measurement system variation was acceptable.

In addition to variation, data bias needs to be considered. This bias is created by systematic measurement errors.

Calibration

Recall that a frequency histogram shows that measurement data is spread about a center value. During calibration, a gage is used to measure a known reference standard that is traceable to a national standard. When the measurements are repeated, the data will show some variation. When the data shows a bell shape about a center, the average is a good indicator of the center. The difference between the average and the reference is called bias, calculated as

$$BIAS = \bar{X}-X_{ref}$$

(1)

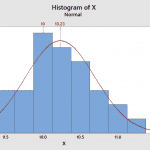
This can be easily illustrated. Consider the case where a standard gage block with a reference value of 10 (units) was measured 30 times by a single appraiser and the values recorded. The average of the measurements should be about 10, however the data statistics show a sample average of 10.23 and sample standard deviation of 0.4635. To visualize the data, Minitab was used to create a histogram of the data with normal distribution. Then, the reference value of 10 and the data average of 10.23 were added to the chart.
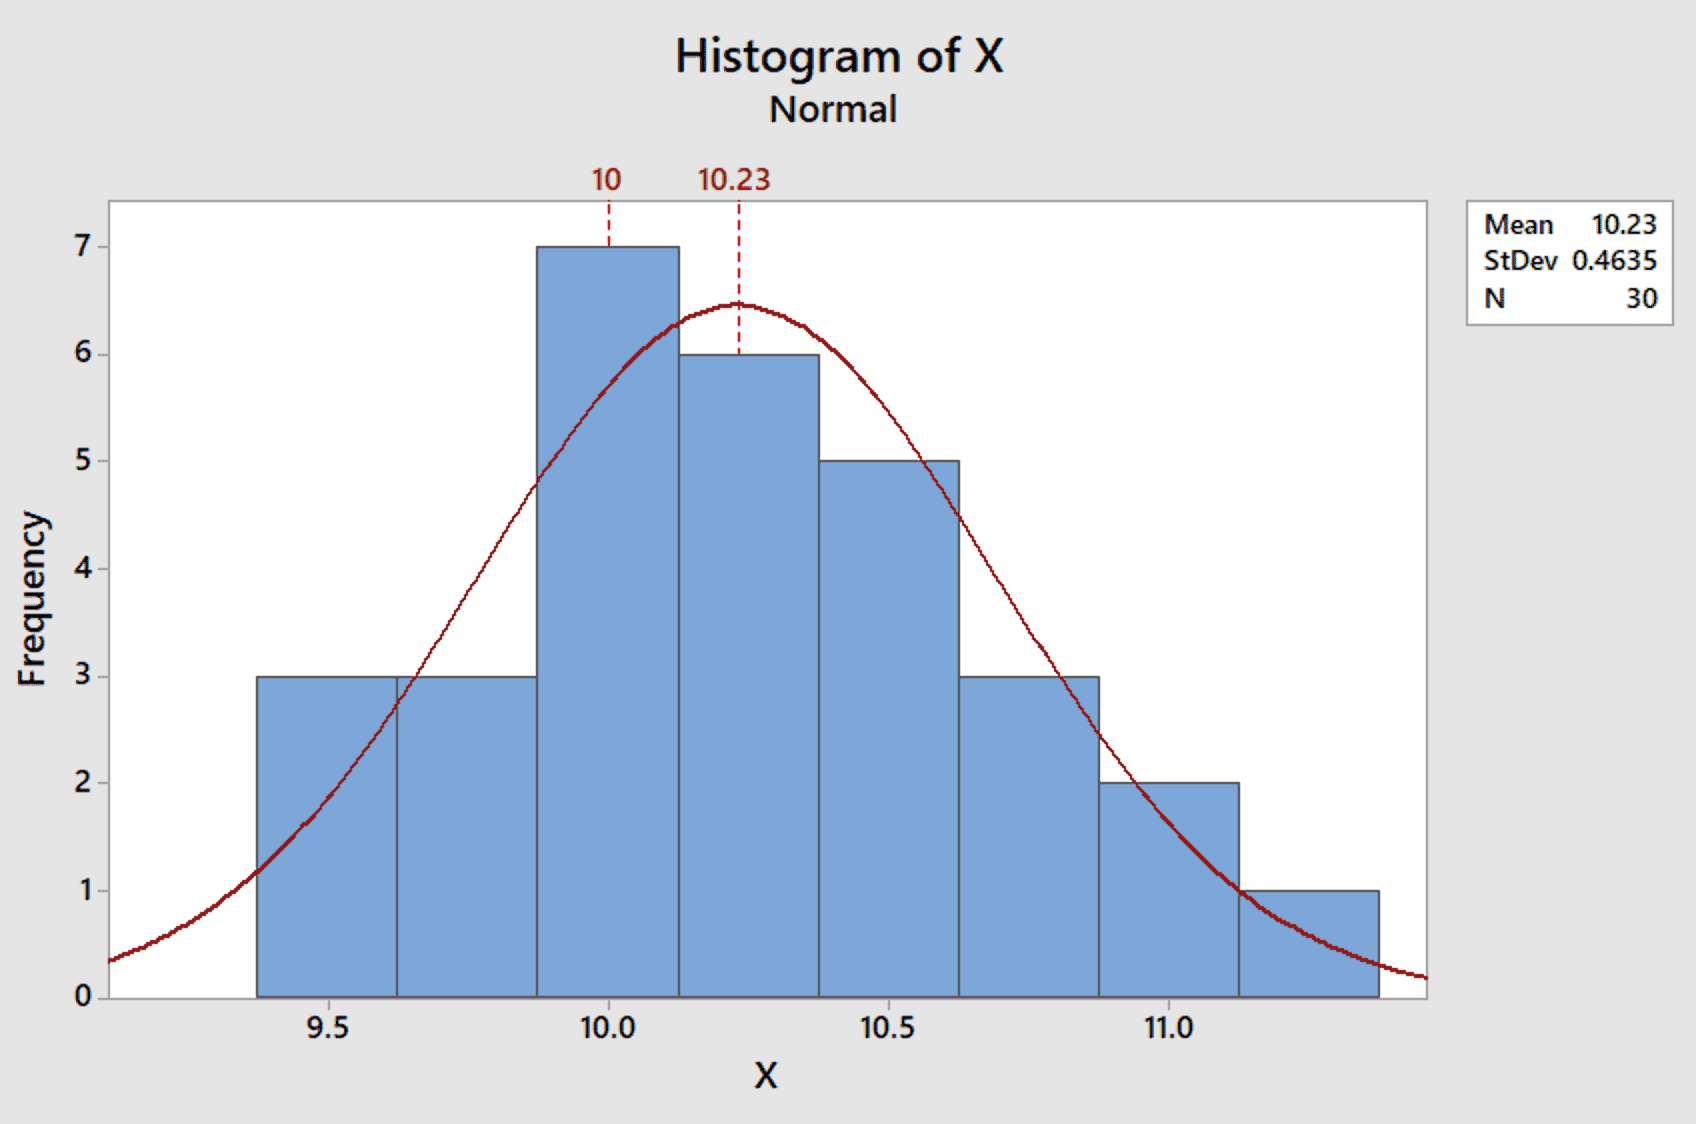
Figure 1

Using equation 1, the gage bias is 0.23, but this could be caused sampling errors. Note that 10 and 10.23 are both contained within the spread of the data.  So how can the significance of the bias be determined?

Significance

With this data set, bias was positive, but in other situations, the bias could be negative. Any significance test should consider both cases.

Hypothesis testing can be used to determine the significance. In hypothesis testing, there is a null hypothesis $-H_O-$ and an alternative hypothesis $-H_A-$. For this analysis, the null hypothesis is that the bias = 0. The alternate hypothesis is that the bias is significantly different than 0. In hypothesis testing, this is expressed as:

$$H_O: \mu=0$$

$$H_A: \mu\neq0$$

(2)

The sample average $-\bar{X}-$ is normally distributed about the population mean $-\mu-$ and is approximately normally distributed with a variance of $-\sigma-$.  We don’t know $-\mu-$ and $-\sigma-$, but know the sample size N = 30, the sample average $-\bar{X}=10.23-$, and the sample standard deviation $-s=0.4635-$.

The sample average $-\bar{X}-$ follows a t-distribution. If $-H_O-$ is true, then the t-statistic is

$$t=\frac{\bar{X}-\mu}{\sigma/\sqrt{N}}=\frac{10.23-10}{0.4635/sqrt{30}}=2.718$$

(3)

Using a table of t-values and a 90% confidence interval, the critical t-value is 1.70. The sample t-value was 2.718, so the null hypothesis $-H_O-$ is rejected. This leaves us with the alternate hypothesis $-H_A-$. One would be justified to apply a correction factor of -0.23 to the data collected by the gage.

Linearity and Stability

Linearity describes the bias over the gage measurement range. It is discussed in Measurement System Gage Linearity. Stability is the change in bias as the gage ages. This will be discussed in a future article and a link provided here.

Conclusions

Using a single reference standard, gage bias is relatively easy to determine. Hypothesis tests on the data can be used to determine if the bias is statistically significant. If not significant, then the gage correction factor can be 0. If the bias is significant, the bias can be used as a gage correction factor.

Note

If you want to engage me on this or other topics, please contact me. We can discuss your problem/concerns and determine how I can help solve your analysis, design, and manufacturing problems.

I have worked in Quality, Reliability, Applied Statistics, and Data Analytics for over 30 years in design engineering and manufacturing. At Wayne State University, I taught at the graduate level. I also provided Minitab seminars to corporate clients, write articles, and have presented and written papers at SAE, ISSAT, and ASQ.

Dennis Craggs, Consultant
Quality, Reliability and Analytics Services
dlcraggs@me.com
(810) 964-1529


Filed Under: Articles, Big Data & Analytics, on Tools & Techniques

« Ok…I’m going to “level” with you…
Discussing the Controversial Subject of FMEA Prepopulation »

Leave a Reply Cancel reply

Your email address will not be published. Required fields are marked *

Big Data & Analytics series Article by Dennis Craggs

Join Accendo

Receive information and updates about articles and many other resources offered by Accendo Reliability by becoming a member.

It’s free and only takes a minute.

Join Today

Recent Articles

  • Risk And Safety
  • Risk Prioritization in FMEA – a Summary
  • What Are Best Practices for Facilitating Qualitative Assessments?
  • So, What’s Still Wrong with Maintenance
  • Foundation of Great Project Outcomes – Structures

© 2023 FMS Reliability · Privacy Policy · Terms of Service · Cookies Policy

This site uses cookies to give you a better experience, analyze site traffic, and gain insight to products or offers that may interest you. By continuing, you consent to the use of cookies. Learn how we use cookies, how they work, and how to set your browser preferences by reading our Cookies Policy.