
I learned actuarial methods for forecasting and spares planning while working for the US Air Force Logistics Command in the 1970s [AFLCM 66-17 and AFM 400-1]. I am grateful for the education, and I am sorry to report that the USAF has reverted to MTBF management.
The US AFLC actuarial methods were developed for engine management in the 1960s by RAND Corp. [Giesler] They estimated age-interval failure rates and made actuarial forecasts of engine demands depending on the flying-hour program plan. An actuarial forecast is ∑a(s)n(t-s), s=1,2,…,t, where a(s) is actuarial failure rate conditional on survival to age s and n(t-s) is the installed base of age t-s. Periodic meetings consolidated engine lifetime and failure data into agreements on actuarial failure rates, for forecasting engine demands and for war readiness spares requirements.
The USAF actuarial methods assume constant failure rates within short age intervals, Poisson demands, and ignore variance induced by variable flying hours per aircraft in the flying hour program. I later figured out how to estimate actuarial failure rates for all engines, major modules, and their service parts, with or without life-limits and without lifetime data; I computed the distribution of demand forecasts, not Poisson. I offered to show AFIT faculty, AFOSR, AFRL, and RAND how to extend actuarial methods to all service parts [George, 1993].
This year, the Air Force reverted to MTBF management. AFMAN20-116_AFGM2025-01 15 January 2025, revises “AFMAN20-116 PROPULSION LIFE CYCLE MANAGEMENT FOR AERIAL VEHICLES, 2022 as follows…
“MAJCOMs, Depots, and field units will use ATOW {Average Time On Wing] or MTBR [Mean Time Between Removal] as the primary metric to measure RCM effectiveness and overall engine reliability health.”… “Total and inherent ATOW or MTBR will be reported by the Engine TMS manager. Both measures will exclude all serviceable built-up removals and quick turn removals. The inherent ATOW or MTBR will also exclude removals for Foreign Object Damage (FOD), fuel/oil contamination (non-engine related), and other maintenance faults exclusive of the design.” (Notice those excluded events typically occur at a constant rate in time independent of engine ages?)
“ATOW is calculated as: ATOW = ∑ EFH removed engine ÷ # removals, where ∑ EFH removed engine is the sum of flying hours since the last removal on only the engines removed in a given quarter. This is calculated manually as CEMS and Propulsion Actuarial Client/Server do not automatically report this number. 10.4.1.2.4. Quarterly data from Propulsion Actuarial Client/Server is used for EFH and number of removals. 10.4.1.2.5. MTBR is calculated quarterly by the Engine TMS actuary, using a four-quarter rolling average to smooth any seasonal variation, and posted on the Actuarial SharePoint site.” [GitHub]
The USAF continues to use armchair exercises such as RCM and MTBR=hours/removals as of 15 Jan. 2025! “By Order of the Secretary of the Air Force, this Guidance Memorandum immediately changes AFMAN 20-116, Propulsion Life Cycle Management for Aerial Vehicles. Compliance with this memorandum is mandatory. To the extent its directions are inconsistent with other Department of the Air Force publications, the information herein prevails, in accordance with DAFI 90-160, Publications and Forms Management.”
Dispute?
Does the US Department of Government Efficiency deserve credit for the elimination of actuarial methods from engines’ and parts’ management? Technically, efficiency is the ratio of the useful work performed by a machine or process to the total energy expended. This reversion to MTBF management produces less useful information but requires less work than actuarial methods.
Google AI says, “In the context of reliability, ‘efficiency’ refers to the ability of a system to perform its intended function consistently over time with minimal wasted effort or resources, essentially maximizing output while minimizing downtime and failures, meaning a system not only functions reliably but does so with optimal resource usage; it’s about achieving the desired result with the least possible input needed.”
What could possibly go wrong with MTBF management as if failure rates were constant?
Compare Statistics of Alternative Failure Rate Functions
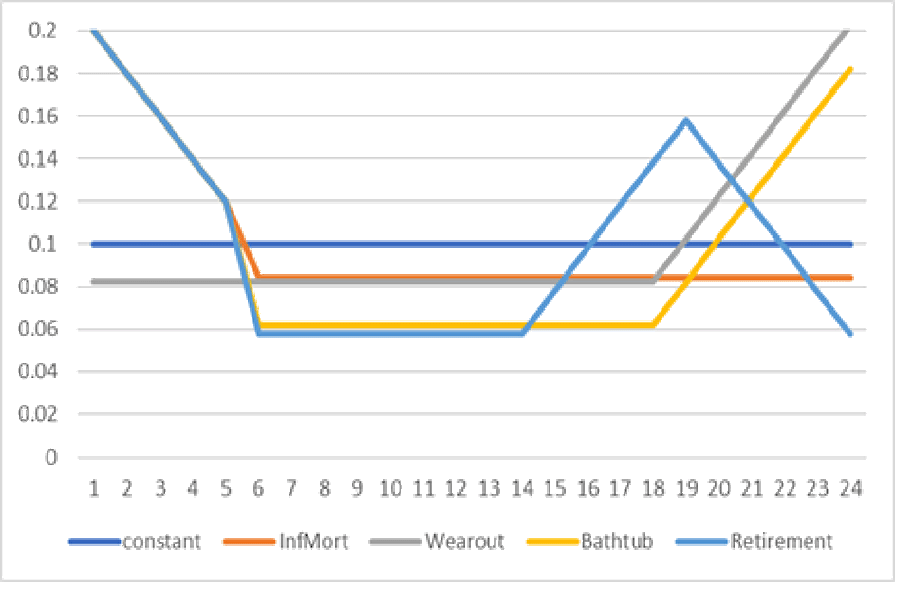
Compare piecewise linear failure rate functions vs. constant failure rate: infant mortality \___, wearout ___/, bathtub \___/, and bathtub followed by retirement \___/\. These alternatives are rigged so that they all have the same probability of failure, 90.9%, by age 24. Infant mortality, wearout, and retirement extend over five or six age intervals.
Table 1. Alternative failure rate functions
| Age | Constant | Inf Mort | Wearout | Bathtub | Retirement |
| 1 | 0.1 | 0.2 | 0.0825 | 0.2 | 0.2 |
| 2 | 0.1 | 0.18 | 0.0825 | 0.18 | 0.18 |
| 3 | 0.1 | 0.16 | 0.0825 | 0.16 | 0.16 |
| 4 | 0.1 | 0.14 | 0.0825 | 0.14 | 0.14 |
| 5 | 0.1 | 0.12 | 0.0825 | 0.12 | 0.12 |
| 6 | 0.1 | 0.0842 | 0.0825 | 0.062105 | 0.057895 |
| Etc. | 0.1 | 0.0842 | 0.0825 | 0.062105 | 0.057895 |
| 15 | 0.1 | 0.0842 | 0.0825 | 0.062105 | 0.077895 |
| 16 | 0.1 | 0.0842 | 0.0825 | 0.062105 | 0.097895 |
| 17 | 0.1 | 0.0842 | 0.0825 | 0.062105 | 0.117895 |
| 18 | 0.1 | 0.0842 | 0.0825 | 0.062105 | 0.137895 |
| 19 | 0.1 | 0.0842 | 0.1025 | 0.082105 | 0.157895 |
| 20 | 0.1 | 0.0842 | 0.1225 | 0.102105 | 0.137895 |
| 21 | 0.1 | 0.0842 | 0.1425 | 0.122105 | 0.117895 |
| 22 | 0.1 | 0.0842 | 0.1625 | 0.142105 | 0.097895 |
| 23 | 0.1 | 0.0842 | 0.1825 | 0.162105 | 0.077895 |
| 24 | 0.1 | 0.0842 | 0.2025 | 0.182105 | 0.057895 |
What are the consequences of inconstant failure rate functions? Inconstancies are actionable compared with the causes of constant failure rates, usually accidents: pilot error, FOD, fuel, or maintenance. It’s hard to quantify risks of ignoring infant mortality or wearout, without costs, so consider statistical measures of their differences from the constant failure rate implied by the MTBR management: means, variances, standard deviations, coefficients of variance, and Kullback-Leibler Divergences. KLDiv measures information lost [bits] compared with information in a constant failure rate.
Tables 2 and 3 compare statistical differences from constant failure rates. All are conditional on failure by age 24. Table 2 parameters except KLDiv are computed using the discrete approximations such as the mean = ∑t*P[Fail at Age t|Age t<=24]. The Excel discrete approximations are not perfect. The exact conditional mean with constant failure rate is 7.76 according to Mathematica.
Table 2. Parameters from alternative failure rate functions with the same probability of failure conditional on failure within the first 24 age intervals. CV stands for coefficient of variation, Stdev/Mean..
| Parameter | Constant | InfMort | Wearout | Bathtub | Retirement |
| Mean | 8.11 | 6.44 | 9.46 | 7.13 | 6.99 |
| Variance | 36.72 | 36.07 | 46.23 | 48.00 | 43.17 |
| Stdev | 6.06 | 6.01 | 6.80 | 6.93 | 6.57 |
| CV | 74.68% | 93.27% | 71.85% | 97.15% | 93.93% |
| KLDiv | 0 | 0.0773 | 0.0250 | 0.1221 | 0.1261 |
Table 3. Simulated parameters from 100 conditional lifetimes
| Parameter | Constant | InfMort | Wearout | Bathtub | Retirement |
| Mean | 6.21 | 5.92 | 8.32 | 5.04 | 6.64 |
| Variance | 31.06 | 37.43 | 40.62 | 39.41 | 45.30 |
| Stdev | 5.57 | 6.12 | 6.37 | 6.28 | 6.73 |
| CV | 89.74% | 103.34% | 76.61% | 124.56% | 101.37% |
Naturally, nearly all the alternative statistical parameters are more variable than those of constant failure rate parameters. Kullback-Leibler divergences indicates there is information lost by not using age-specific actuarial failure rates. The USAF Logistics Command assumed engine demands have Poisson distributions where means equal variances, corresponding to exponentially distributed lifetimes, without life limits. Even the constant failure rate function alternative has greater variance than mean.
Conclusions and Recommendations?
My summer job after high school was in an aircraft contractor making templates for die cast jet engine parts. They gave me the job of drilling ~1200 holes in a large 1/16” aluminum sheet. Checker caught mistakes on quite a few holes. I fixed the mistakes. I asked coworkers what was the sheet for? It was a template for a jet engine scatter shield in case jet engines disintegrated. They laughed about whether 1/16” steel could contain errant fan blades and disc parts. Don’t sit on a plane next to the engine fan or compressor sections.
Life limits are supposed to be set to prevent wearout. It’s hard to discern wearout if all that is reported is MTBR. Years ago, Cessna asked for engine failure rate function estimates prior to warranty expiration. They guaranteed customers a smaller failure rate than field data showed, nearly 20%. That caused company lawyers to get involved, because Lycoming made Cessna’s engines and both Cessna and Lycoming were owned by Textron. Never heard how that case settled, if ever.
I am concerned about those who fly USAF aircraft! I’ve seen the insides of gas turbine engines being overhauled. Near daily aircraft accidents make my wife very uncomfortable to fly, and her family lives in Norway. Do airlines use actuarial methods for engine management? Are USAF and airlines content with armchair exercises: MTBR, FMEA, FRACAS, and RCM? Do airlines estimate actuarial rates of engines, major engine modules, and service parts, even for RCM classification? [Nowlan and Heap, George 2020] Why not?
References
AFLCM 66-17, “Quantitative Analyses, Forecasting, and Integrative Management Techniques for Maintenance Planning and Control,” U.S. Air Force Logistics Command, Wright-Patterson AFB, Ohio, March 27, 1970, revised June 20, 1973
AFM 400-1, “Logistics, Selective Management of Propulsion Units, Policy and Guidance,” U.S. Air Force, June 21, 1976
Murray Geisler, “The Rand Logistics Research Program 1966,” Santa Monica, CA: RAND Corporation, 2004, https://www.rand.org/pubs/papers/P3447.html/
Murray Geisler et al., “Structure and Analysis of the Air Force Logistics System,” ADA046216, Logistics Management Institute, 1977, https://apps.dtic.mil/sti/tr/pdf/ADA046216.pdf/
Department of the Air Force, “AFMAN20-116_AFGM2025-01” Jan. 15, 2025,
https://static.e-publishing.af.mil/production/1/saf_aq/publication/afman20-116/afman20-116.pdf
L. L. George, “Estimate Reliability Functions Without Life Data,” ASQC Reliability Review, Vol. 13, March 1993, https://accendoreliability.com/estimate-reliability-functions-without-life-data/#more-623473/
L. L. George, “Failure Rate Classification for RCM,” Weekly Update, Sept. 2020, https://accendoreliability.com/failure-rate-classification-for-rcm/#more-499494/
Nowlan, F. S. and Howard Heap, “Reliability-Centered Maintenance,” United Airlines, AD/AO66-579, Dec. 1978

Leave a Reply