
There are four functions related to life distributions of importance to reliability engineering.
Nearly all textbooks on reliability either introduce or use these functions. Likewise, nearly every calculation related to reliability statistics also uses at least one of functions.
Suppose we produced 100 units of a product and tracked them all till failure over time.
Eventually, all of them would fail. And, unlike the Parson’s One Hoss Shay the products and their components would not all fail at the same time.
One way to track the failures over time is to use a simple histogram.
By plotting the number of failures each month, for example, we would create a representation of the distribution of time to failures.

The histogram represents a Probability Density Function (PDF), f(t). Where the function is always positive and has a total area of one.
Mathematically for continuous distributions

And, for discrete distributions, we have a similar relationship using summation.
In this short note, we will only discuss the continuous distribution case.
Based on probability theory ( the subject of another discussion), we know that at the initial point none of the 100 units have failed. And, we know that eventually all of the units will fail.
Thus over any particular interval of interest, time, in this case, we can determine the probability of failure


The mean and variance terms can also be determined at this point.
Where E is the expected value and T is a random variable (more on this in another posting) and knowing the first moment of the random variable about the origin is defined as the distributions mean, μ. For a continuous distribution

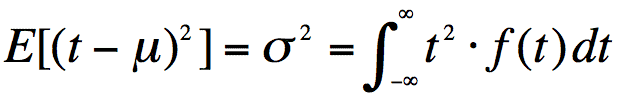
And, the variance, σ, is the second moment of the expected value. For continuous distributions
Of course, the positive square root of the variance is the standard deviation.
The Cumulative Distribution Function (CDF) F(t) for a continuous distribution describes the fraction failing by age t.
The CDF describes the probability that an event, a failure, occurs at some point in time.

F(t) ranges from zero to one and is monotonic, meaning as time, t, increases the probability steadily increases.
And, as you may suspect, the CDF is related to the PDF, as the CDF quantifies the area under the curve (the PDF) over time.

Note the upper limit is the end point of the period of interest, and the start is, well, the start, or when everything is considering functioning or working.
Using the histogram above we can step through each instance and calculate the probability of failure to produce the CDF plot.
And, from the plot, we can estimate the probability of failure at one year as about 60% failed by 8760 hours.

The CDF looks at the probability of failures, yet sometimes we are interested in how many will still be operating after some period of time.
Considering the overall probability ranges from zero to one, and a little probability theory, we can define the Reliability function as the complement of the CDF.


As you can see, the R(t) is similar to F(t), only R(t) starts with all the units working descends to none working.

The fourth function, the Hazard Rate, h(t), or Failure Rate, is the rate units, which have survived to a point in time, will fail.
Think conditional probability. If 90 units are still working at time, t, then what is the expected probability of failure for the units now?
The failure rate can and often does change over time. The familiar ‘bathtub curve’ shows the hazard rate decreasing initially in the ‘infant mortality’ phase, then steady, and finally increasing during the wear-out phase.
In practice, it is rare that the failure rate remains constant for a significant period of time.
The hazard rate is the limit of the instantaneous failure rate given no failures up to time t, or


Therefore, if you know one function one can determine the other three functions.
Most of the time we work with these functions in relation to a particular distribution.
Over the next couple of posts, we will explore the commonly used distributions and their related functions.
In the meantime, work out how to derive all functions when starting with one in particular.
The refresher on algebra and calculus will be good for you.
Related:
Reliability Function (article)
Using The Exponential Distribution Reliability Function (article)
Exponential Reliability (article)

Fred, maybe due to a mistyping, the formula f4 shall be corrected adding the dt after the function t^2 f(t) .
Thanks for the note – I’m working on editing the formula and updating.
cheers,
Fred