Introduction
Statistical Process Controls (SPC) is a suite of methods that can be employed to control a manufacturing or assembly process. It has a wide range of potential applications ranging from consumer products to defense. It can be employed at the lowest element of component manufacturing or an assembly operation.
This article discusses the assumptions necessary to understand SPC.
Fundamental Assumptions
- The process is stable and in control.
- The data are independent of each other.
- The data of each subgroup are identically distributed.
- Real valued data are approximately normally distributed and counting data may be approximated by the normal distribution.
- A measurement can occur in only one subgroup, i.e., sampling without replacement.
Stable Controlled Processes
The most important assumption is that a process can be controlled. The process is subject to common causes of variation, but special causes are absent. I was involved in a component process signoff. The process injected molded material around a sensor. The material needed to be preheated prior to the injection molding process. However, the process controls were not secured. Anybody with access to the work station could adjust the dials. It was easy to set the duration to zero. The material would be injected at room temperature, damage the electronics, and produce defective parts. The plant quality manager was alerted to the issue, access to the control was restricted to the process control engineers, and removed this special cause of defects.
The challenge is to identify potential special causes before defects occur. Special causes can come from materials, methods, personnel, tools, machinery, and the environment. In modern manufacturing software controls and electronics need to be considered. A process FMEA should be created and reviewed by a team of design, manufacturing, and quality engineers plus experienced line personnel. For carryover processes with minor modifications, the team should focus on prior failure modes and the modifications.
Independence
The standard statistical assumption is that the data is independent and uncorrelated with the prior values. Any variation is from common causes. An example of a correlated process is the flight path of an aircraft. The current position is determined by the prior flight history, i.e., position and velocity. Embedded in the flight data is both common cause and special cause. A special cause would be changes in the flight controls. A common cause would be instrument measurement errors.
In manufacturing, tool wear is a cause of variation for some processes. The process average is constantly shifting, but at a known rate. About the expected average, there is variation due to common cause. The data can be corrected to account for the shift in the process average and the remaining variation should be common cause. A special SPC chart called the Average and Moving range can be used.
Distributions
The data from a stable controlled process can be described by statistical distribution appropriate to the type of data:
- Real numbers are used to describe continuous variables. Measurements provide real numbered data rounded to some precision by the capability of the measurement equipment. The data can take any value within a range of values subject to some physical constraints. For example, the diameter of a hole or the electrical resistance of a circuit component will never have a negative value. Similarly, extremely large values are restricted for some processes. Measurement equipment provides data rounded to some definite precision. For example, I have a digital caliper that can be used to measure gaps from 0 to 6” with a precision of 0.001”. To analyze the data, the normal distribution is probably the most widely used, but in special situations, the lognormal and Weibull should be considered.
- Counts of defects occur frequently in quality data. The count is a non-negative integer. Examples of this type of data could be the number of bubbles above a specific size in a unit of glass. Similarly, a void count in a cast or injection molded part is a reasonable quality measure. The binomial and Poisson distributions are used with counting data.
- Other types of data may be subjective. For example, during the injection molding of an aluminum part, the mold surface can wear. The surface displays a unique appearance, but is difficult to measure. In this case, a picture of a worn mold was needed to alert the operator and the process engineers that a mold change was required.
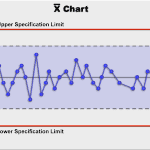
Sample Group Distribution
Instead of measuring 100% of product, SPC methods rely on sampling. Sample groups from a stable process will show similar process averages and variation. If a special cause occurs, the process can suddenly shift to a new average and/or show a variation change. SPC charts provide visual descriptions of these sample groups average and variation. A goal is to make high probability decisions of the presence or absence of special causes.
Conclusions
If a process is stable and in control, the individual data are independent, data variation is due to common cause, then SPC methods may be used. The appropriate statistical method depends on the type of data to be analyzed.
Future articles in this series present further discussion of data types, the appropriate distribution, and how to construct control charts. The next article considers continuous variable measurement data, the normal distribution, and control charts. Understanding the construction of the charts builds an understanding of how to use the charts.
Note
If anybody wants to engage me as a consultant or trainer on this or other topics, please contact me. I have worked in Quality, Reliability, Applied Statistics, and Data Analytics over 30 years in design engineering and manufacturing. In the university, I taught at the graduate level. Also, I provide Minitab seminars to corporate clients, write articles, and have presented and written papers at SAE, ISSAT, and ASQ. I want to assist you.
Dennis Craggs, Consultant
810-964-1529
dlcraggs@me.com

Leave a Reply