
If process capability analysis is something you already “know how to do,” this article is for you.
Most quality professionals in the forging industry are familiar with Cp, Cpk, Pp, and Ppk. You have calculated them dozens, perhaps hundreds, of times. You have entered data into an Excel or Minitab worksheet, checked whether the result exceeded some threshold such as 1.33, inserted the output into a PPAP package, then transmitted it to the customer. From a procedural standpoint, the work was complete.
But in doing so, many professionals miss the most valuable aspect of capability analysis: what it reveals about the process itself.
Early in my quality career, I poured through the textbooks and taught myself process capability analysis in preparation for the Certified Quality Engineer exam. The learning curve was steeper than I expected. Once I understood it, however, it became one of the most useful devices in my analytical toolkit. Its value was not in the calculation of an index, but in the way it forced disciplined thinking about how a process behaves. Over time, as I applied these tools in PPAP submissions, root cause investigations, and continuous improvement efforts, a recurring pattern emerged. Many practitioners were applying the correct formulas while answering the wrong question.
At its core, process capability analysis is a comparison between two voices: the Voice of the Customer and the Voice of the Process.
The Voice of the Customer is fixed. It is communicated through engineering drawings and specifications. Features such as flange thickness, hub diameter, or bore location are assigned tolerances that define what the customer will accept. A flange thickness on a wheel spindle forging, for example, is often designated as a special characteristic because it influences downstream fit, load distribution, or fatigue performance. The specification exists because the customer has a clear expectation for that feature.
The Voice of the Process is not fixed. It must be learned.
It reflects what the forging process naturally produces given the tooling, material condition, temperature, lubrication, setup, and more. Process capability analysis is a structured way to estimate that natural behavior and compare it to the specification window defined by the customer.
When applied correctly, capability analysis provides insight into risk. It helps quantify how likely a process is to violate customer requirements if the underlying conditions remain unchanged.
Difficulties arise when capability indices are treated as pass–fail criteria rather than as models of process behavior. A Cp or Cpk value does not certify that a process is “good.” It does not guarantee future performance, and it does not explain why variation exists. It is a statistical construct built on assumptions related to stability, distribution, and the time frame of the data. When those assumptions are not understood or examined, the resulting index can appear authoritative while conveying little real understanding.
This is why two engineers can calculate the same capability index for the same forging feature and reach very different conclusions. One sees a number that satisfies a customer requirement. The other sees information about centering, stability, and opportunity for improvement.
A Brief Orientation to the Capability Indices
Before moving further, it is useful to briefly orient ourselves to the capability indices most commonly encountered in practice. While Cp, Cpk, Pp, and Ppk are often discussed as distinct tools, they are all variations on the same fundamental comparison between the Voice of the Customer and the Voice of the Process.
The simplest form of this comparison is expressed through Cp and Pp, which relate the full specification width to the natural spread of the process:
$$ \displaystyle\large C_{p}=\frac{\left(USL-LSL\right)}{6\hat{\sigma}} $$ $$ \displaystyle\large P_{p}=\frac{\left(USL-LSL\right)}{6s} $$In these expressions, the numerator represents the Voice of the Customer, again, the allowable specification range defined on the print. The denominator represents the Voice of the Process, an estimate of the process spread. The distinction between the two indices lies only in how that spread is estimated. Cp uses $-\hat{\sigma}-$ 
Neither Cp nor Pp considers where the process is centered within the specification limits. A process may be tightly controlled yet shifted entirely toward one limit, and these indices will not reflect that condition.
That consideration is introduced through Cpk and Ppk, which account for the distance between the process mean and the nearest specification limit:
$$ \displaystyle\large _{\text{pk}}=\min\left(\frac{\text{USL}-\bar{x}}{3\hat{\sigma}},\frac{\bar{x}-\text{LSL}}{3\hat{\sigma}}\right) $$ $$ \displaystyle\large _{\text{pk}}=\min\left(\frac{\text{USL}-\bar{x}}{3s},\frac{\bar{x}-\text{LSL}}{3s}\right) $$Here again, the difference between Cpk and Ppk is not in the structure of the equation, but in the estimate of dispersion used in the denominator. As shown in figure 1, both indices describe how much room exists between the process average, $-\bar{x}-$
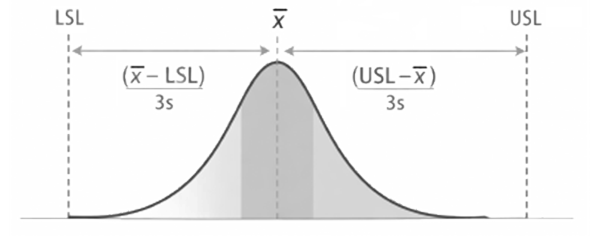
Despite the variety of indices and symbols, the underlying logic is the same in every case. Each index is a ratio comparing customer requirements to process behavior. What changes from one index to another is not the question being asked, but the assumptions made about how the data were collected, over what timeframe, and what sources of variation are included.
With that orientation in place, it becomes easier to step back from the mechanics of the formulas and focus on what process capability analysis is actually telling you about your process.
What Process Capability Analysis Is Actually Telling You
Stripped of formulas, process capability analysis is an exercise in inference.
You begin with a limited set of measured data points, taken from a process operating under a specific set of conditions, and you use those data to make a judgment about how that process is likely to behave in the future. Capability analysis does not tell you what happened to the parts you already produced. It tells you what is likely to happen if the process continues unchanged. That distinction is subtle, but it is fundamental.
The Voice of the Customer is established in the design record, but the Voice of the Process, by contrast, is probabilistic. It reflects the natural spread of outcomes the process produces over time. Capability analysis is the point at which those two voices are compared in a structured and quantitative way.
What the analysis is actually telling you is how much risk exists between them.
When the natural spread of the process is small relative to the specification window, the risk of producing nonconforming parts is low. When the process spread approaches or exceeds the available tolerance, the risk increases rapidly.
Importantly, this risk exists whether or not nonconforming parts have already been observed. A process can produce only conforming parts today and still be fundamentally incapable.
This is why capability analysis should never be interpreted as a historical scorecard. Instead, it is a model of expected behavior based on assumptions about the process and the data used to represent it.
In a forging environment, this distinction matters. Consider a flange thickness designated as a special characteristic. A short production run may yield measurements that all fall comfortably within specification. A capability index calculated from those data may appear acceptable. But if that dataset captures only a narrow time window, a single tool condition, or a favorable thermal state, the analysis may be describing a best-case scenario rather than the process as it is typically experienced.
Capability analysis is most informative when it reveals tension between the process and the specification. It highlights how much margin exists for tool wear, temperature drift, or setup differences before the process begins to challenge customer requirements. In that sense, the value of the analysis is not in confirming that everything is acceptable, but in exposing how fragile or robust the process truly is.
This also explains why capability analysis often produces discomfort when it is used correctly. It forces acknowledgment that a process does not have unlimited freedom within a tolerance band. It quantifies how tightly the process is constrained, even when parts are still meeting specification. That information can be inconvenient, especially when schedules are tight and customer demands are high, but it is precisely what enables informed decision-making.
At its best, process capability analysis functions as a translation layer. It converts raw measurement data into a statement about risk that can be understood by engineers, quality professionals, and management alike. It does not tell you what action to take, but it clarifies the consequences of doing nothing.
When capability analysis is reduced to the generation of a single index value for reporting purposes, this insight is lost. The analysis becomes an artifact rather than a tool for understanding. To move further along the learning curve, it is necessary to treat capability not as a destination, but as a means of interrogating how a process behaves relative to what the customer expects.
The Assumptions That Give Capability Analysis Meaning
Process capability analysis only works to the extent that its underlying assumptions are valid. When those assumptions hold, capability indices can be powerful summaries of process behavior. When they do not, the analysis may still produce a number, but that number no longer carries the meaning we often ascribe to it.
The first and most important assumption is process stability.
Capability analysis assumes that the process is behaving consistently over the period represented by the data. In practical terms, this means the process is not experiencing uncontrolled shifts, trends, or step changes while the data are being collected. In a forging operation, this assumption is frequently challenged by tool wear, temperature changes, die maintenance, material lot variation, and setup adjustments. A capability index calculated from data that span multiple, materially different process states may describe none of them particularly well.
When stability is absent, capability analysis tends to average over differences rather than reveal them. The resulting index can mask important changes in process behavior and create a false sense of security.
A second assumption concerns the timeframe represented by the data.
Every capability study implicitly answers the question, “Capable over what period of time?” A short-term dataset may reflect a freshly set die, a stable press temperature, and attentive setup practices. A longer-term dataset may include tool wear, thermal cycling, and normal operational variation. Neither perspective is inherently correct or incorrect, but each answers a different question. Problems arise when the timeframe of the data does not align with the decisions being made from the analysis.
For example, a capability index calculated from a short production window may be suitable for an initial process study on a special characteristic. That same index may be inappropriate for assessing ongoing risk over weeks or months of production. Without clarity on timeframe, capability values are easily misinterpreted.
A third assumption is distributional behavior.
Traditional capability indices assume that the underlying data follow a reasonably well-behaved statistical distribution, often approximated as the bell-shaped normal distribution. In forging processes, this assumption is not always justified. Data may be skewed due to adjustment rules, truncated by inspection practices, or exhibit multiple modes as setups or operating conditions change. A histogram that clearly departs from a single, symmetric shape is an early warning sign that a conventional capability index may not be describing reality.
When distributional assumptions are violated, capability indices can dramatically overstate or understate risk. The presence of a precise numerical result does not imply that the model used to generate it is appropriate.
A fourth assumption relates to data representativeness.
The measurements used in a capability study are assumed to reflect how the process actually operates. In practice, data are often collected under more controlled or favorable conditions than those that prevail during routine production. Measurements may be taken shortly after setup, during supervised runs, or from parts that operators have already identified as “good.” In such cases, the Voice of the Process being captured is an idealized version rather than a realistic one.
When representativeness is compromised, capability analysis becomes an exercise in describing how the process behaves when everything goes right, not how it behaves most of the time.
None of these assumptions invalidate capability analysis. They define its boundaries.
Experienced practitioners learn to interrogate these assumptions before trusting the results. They ask what the data actually represent, what the process was doing while the data were collected, and how closely those conditions align with the decisions the analysis is intended to support. Capability analysis gains meaning from the care taken to ensure its assumptions are reasonably satisfied.
This is also where confusion between different capability indices often begins. When assumptions about stability, timeframe, or data structure are left unexamined, practitioners may reach for one index over another without fully understanding what question each is equipped to answer. That confusion, and its consequences, is the next issue worth addressing.
Why Confusing Cpk and Ppk Leads to the Wrong Conclusions
Few topics in process capability analysis generate more confusion than the distinction between Cpk and Ppk. Most professionals can recite some version of the explanation. One is “short-term,” the other is “long-term.” One uses within-subgroup variation, the other uses overall variation. These statements are not wrong, but they are incomplete. More importantly, they often distract from the real issue: what question the analysis is actually answering.
Cpk and Ppk are not competing measures of the same thing. They describe different views of process behavior, each conditioned on different assumptions about time, stability, and data structure. When those assumptions are not examined, the resulting capability index may be technically correct and practically misleading. Figure 2 illustrates these differing measures of process variation.
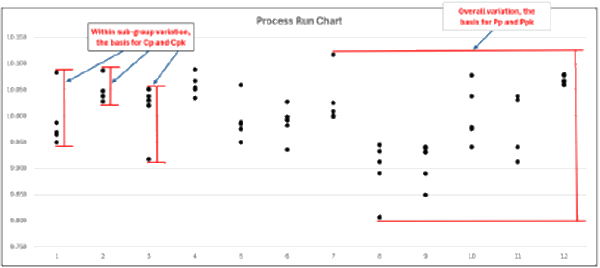
At a conceptual level, Cpk reflects how a process behaves over relatively short intervals when operating conditions are reasonably consistent. It is driven primarily by variation within those intervals. In forging, this might correspond to behavior observed during a stable portion of a run, with a given die condition, press temperature, and setup. When those conditions hold, Cpk can provide useful insight into how tightly the process is behaving around its mean.
Ppk, by contrast, reflects how the process behaves when variation across time is allowed to accumulate. It incorporates not only short-term variation, but also the effects of drift, wear, adjustment, and other changes that occur as production continues. In a forging operation, this may include tool wear over multiple shifts, thermal changes as the press heats and cools, or material differences across heats or lots. Ppk captures a broader picture of risk, but often at the cost of obscuring what is happening within any given operating window.
The mistake is assuming that one can substitute for the other without changing the question being asked.
A Cpk calculated from data taken shortly after setup may indicate that the process is well centered and tightly controlled. That result may be entirely accurate for that specific window of operation. A Ppk calculated from data spanning days or weeks may tell a different story, reflecting the cumulative effects of wear and adjustment. Both indices may be correct, and both may be useful. Confusion arises when one is used to answer a question the other was never designed to address.
This is where the familiar “short-term versus long-term” explanation often fails practitioners. It suggests a hierarchy, as though one index is more legitimate or more conservative than the other. In reality, each index encodes a different set of assumptions about the process and the data. Without clarity on those assumptions, the numerical result becomes detached from its meaning.
In practice, this confusion often shows up in customer communication. A capability index is calculated to satisfy a submission requirement, not to understand the process. The choice of Cpk or Ppk is driven by convention or template rather than intent. When the resulting number clears a required threshold, the analysis stops. What the process is actually doing, and why, remains unexamined. This approach reduces capability analysis to a compliance exercise.
Knowledgeable professionals begin by asking what timeframe and conditions the data represent, how stable the process was during collection, and what sources of variation are included or excluded. Only then does the choice between Cpk and Ppk become meaningful.
When capability indices are interpreted in this way, they regain their value as tools for understanding rather than artifacts for reporting. Confusion diminishes not because the formulas are better remembered, but because the underlying assumptions are made explicit and aligned with the decision at hand.
Moving Beyond the Checkbox
Process capability analysis is often treated as a destination. A number is calculated, a threshold is met, and the analysis is considered complete. But capability was never intended to be an endpoint. It is a means of understanding how a process behaves relative to what the customer expects, and how much risk exists between the two.
When capability analysis is approached as a checkbox exercise, its value collapses to a single digit. When it is approached as a thinking tool, it becomes a way to interrogate process behavior.
Used properly, capability analysis forces clarity. It doesn’t tell you what actions to take, but it sharpens your understanding of the consequences of action or inaction.
As professionals gain experience, the role of capability analysis changes. Early on, it is natural to focus on how to calculate the indices correctly. With time, the more important skill becomes knowing when a capability result is meaningful, when it is incomplete, and when it is answering a different question than the one being asked. That progression marks a shift from calculation to judgment.
When capability analysis is used this way, both the supplier and the customer benefit. Conversations move beyond whether a number clears a threshold and toward how a process can be made more robust over time. That is where the real value of the tool resides, and where its original intent is finally realized.
RH
Ray Harkins is a senior manufacturing operations and quality professional with 30+ years of leadership experience driving customer-focused performance in high-volume, complex environments. He is currently the General Manager of Lexington Technologies in Lexington, North Carolina. He earned his Master of Science from Rochester Institute of Technology and his Master of Business Administration from Youngstown State University.
He also teaches more than 60 quality, engineering, manufacturing, and business-related courses through the Udemy platform, recently integrated into Coursera. His courses include:
Quality Engineering Statistics
Reliability Engineering Statistics
Failure Modes and Effects Analysis (FMEA)
Root Cause Analysis and the 8D Corrective Action Process
He can be reached via LinkedIn at linkedin.com/in/ray-harkins or by email at the.mfg.acad@gmail.com.



Leave a Reply