Accendo Reliability

Your Reliability Engineering Professional Development Site

  • Home
  • About
    • Contributors
    • About Us
    • Colophon
    • Survey
  • Reliability.fm
    • Speaking Of Reliability
    • Rooted in Reliability: The Plant Performance Podcast
    • Quality during Design
    • Reliability 4.0
    • CMMSradio
    • Way of the Quality Warrior
    • Critical Talks
    • Asset Performance
    • Dare to Know
    • Maintenance Disrupted
    • Metal Conversations
    • The Leadership Connection
    • Practical Reliability Podcast
    • Reliability Gang
    • Reliability Hero
    • Reliability Matters
    • Reliability it Matters
    • Maintenance Mavericks Podcast
    • Women in Maintenance
    • Accendo Reliability Webinar Series
  • Articles
    • CRE Preparation Notes
      • Reliability Bites
    • NoMTBF
    • on Leadership & Career
      • Advanced Engineering Culture
      • ASQR&R
      • Engineering Leadership
      • Managing in the 2000s
      • Product Development and Process Improvement
    • on Maintenance Reliability
      • Aasan Asset Management
      • AI & Predictive Maintenance
      • Asset Management in the Mining Industry
      • CMMS and Maintenance Management
      • CMMS and Reliability
      • Conscious Asset
      • EAM & CMMS
      • Everyday RCM
      • History of Maintenance Management
      • Life Cycle Asset Management
      • Maintenance and Reliability
      • Maintenance Management
      • Plant Maintenance
      • Process Plant Reliability Engineering
      • RCM Blitz®
      • ReliabilityXperience
      • Rob’s Reliability Project
      • The Intelligent Transformer Blog
      • The People Side of Maintenance
      • The Reliability Crime Lab
      • The Reliability Mindset
    • on Product Reliability
      • Accelerated Reliability
      • Achieving the Benefits of Reliability
      • Apex Ridge
      • Beyond the Numbers
      • Breaking Bad for Reliability
      • Field Reliability Data Analysis
      • Metals Engineering and Product Reliability
      • Musings on Reliability and Maintenance Topics
      • Product Validation
      • Reliability by Design
      • Reliability Competence
      • Reliability Engineering Insights
      • Reliability in Emerging Technology
      • Reliability Knowledge
    • on Risk & Safety
      • CERM® Risk Insights
      • Equipment Risk and Reliability in Downhole Applications
      • Operational Risk Process Safety
    • on Systems Thinking
      • The RCA
      • Communicating with FINESSE
    • on Tools & Techniques
      • Big Data & Analytics
      • Experimental Design for NPD
      • Innovative Thinking in Reliability and Durability
      • Inside and Beyond HALT
      • Inside FMEA
      • Institute of Quality & Reliability
      • Integral Concepts
      • Learning from Failures
      • Progress in Field Reliability?
      • R for Engineering
      • Reliability Engineering Using Python
      • Reliability Reflections
      • Statistical Methods for Failure-Time Data
      • Testing 1 2 3
      • The Hardware Product Develoment Lifecycle
      • The Manufacturing Academy
  • eBooks
  • Resources
    • Special Offers
    • Accendo Authors
    • FMEA Resources
    • Glossary
    • Feed Forward Publications
    • Openings
    • Books
    • Webinar Sources
    • Journals
    • Higher Education
    • Podcasts
  • Courses
    • Your Courses
    • 14 Ways to Acquire Reliability Engineering Knowledge
    • Live Courses
      • Introduction to Reliability Engineering & Accelerated Testings Course Landing Page
      • Advanced Accelerated Testing Course Landing Page
    • Integral Concepts Courses
      • Reliability Analysis Methods Course Landing Page
      • Applied Reliability Analysis Landing Page
      • Statistics, Hypothesis Testing, & Regression Modeling Course Landing Page
      • Measurement System Assessment Course Landing Page
      • SPC & Process Capability Course Landing Page
      • Design of Experiments Course Landing Page
    • The Manufacturing Academy Courses
      • An Introduction to Reliability Engineering
      • Reliability Engineering Statistics
      • An Introduction to Quality Engineering
      • Quality Engineering Statistics
      • FMEA in Practice
      • Process Capability Analysis course
      • Root Cause Analysis and the 8D Corrective Action Process course
      • Return on Investment online course
    • Industrial Metallurgist Courses
    • FMEA courses Powered by The Luminous Group
      • FMEA Introduction
      • AIAG & VDA FMEA Methodology
    • Barringer Process Reliability Introduction
      • Barringer Process Reliability Introduction Course Landing Page
    • Fault Tree Analysis (FTA)
    • Foundations of RCM online course
    • Reliability Engineering for Heavy Industry
    • How to be an Online Student
    • Quondam Courses
  • Webinars
    • Upcoming Live Events
    • Accendo Reliability Webinar Series
  • Calendar
    • Call for Papers Listing
    • Upcoming Webinars
    • Webinar Calendar
  • Login
    • Member Home
Home » Articles » Using Crow AMSAA Plots for RCAs

by André-Michel Ferrari Leave a Comment

Using Crow AMSAA Plots for RCAs

Using Crow AMSAA Plots for RCAs

Root Cause Analysis (RCA) Overview

A Root Cause Analysis (RCA) is a structured approach to identifying the underlying factors that result in the unwanted/unexpected outcomes of chronic or sporadic events. It is a methodic and rigorous process. It also highlights what assets, systems or behaviors need to be modified to limit or eliminate recurrence of similar undesirable outcomes. The fundamental driver is to address, correct or mitigate the root causes that lead to the unwanted event(s) rather than addressing the symptom(s). Bob Latino, a renowned RCA expert, summarizes this concept as “the establishing of logically complete, evidence based, tightly coupled chains of factors from the least acceptable consequences to the deepest significant underlying causes.”

RCAs are extremely informative and value-added exercises. They can stand out as “learning moments” for an entire organization. But their depth causes them to be work intensive. Due to limited resources in every organization, the initiation of an RCA has to be carefully evaluated and prioritized.

Crow AMSAA Overview

Crow-AMSAA Plots have a variety of names, such as Reliability Growth Plots or Duane Plots. The term “Crow” comes from Dr Larry H. Crow, who enhanced James T. Duane’s pioneering launch of this methodology, developed in the early 1960s (1). Dr. Crow successfully applied the method in the US Army Materials System Analysis Activity (AMSAA). The technique has blossomed into large amounts of new applications in industry such as, but not limited to:

  • Making reliability more visible and manageable hence contributing to Reliability Improvement Programs,
  • Monitoring Design Optimization and Quality Performance,
  • Catastrophic or adverse event occurrence predictions and trends.

In practical terms, the Crow-AMSAA technique involves plotting, cumulative failures vs cumulative time on a log-log scale resulting in straight line plots (2). The line slope value (or Beta value) indicates improving, deteriorating, or constant failure occurrences. Due to the straight-line nature of the plots, future failure forecasts can be estimated. In plain words, based on the current trend, when is the next failure expected to occur? This method handles mixed failure modes, so it is, therefore, suitable for the complex nature of the generating units.

What is of interest to us in this article is the change in trends. Sometimes undesirable events increase in frequency at a specific moment in time. A higher frequency of occurrence can lead to a change in trend in a Crow AMSAA Plot. When doing an RCA on those events, it is crucial to know when they started. In other words, the timestamp of the event would indicate “what changed” and eventually “when the change occurred”. This allows the RCA team to review decisions made at the time. And speed up the RCA. Remember that RCA exercises are thorough but in so doing, time consuming and tedious. Therefore, any technique that makes the analysis more efficient is welcome. 

Process Trip Example

A basic example of this concept is provided below. Process trips or interrupts were recorded during a specific time interval; from years 2020 to 2025. Those trips occurred following a process overload or component failure. They were concerning to management as they caused stoppages in production leading to downtime, output reduction and potential safety issues. However, initial higher trip intervals were deemed acceptable to management, but later trips increased in frequency causing concern. The time to failure was reduced as shown in the right-hand section of Graph 1 below. Subsequently, a Root Cause Analysis exercise was initiated.

A scatter plot showing the relationship between Time to Process Trip (hours) and Consecutive days since 20 May 2020. The data points show a general downward trend over time.
Graph 1 – Process trip chronological records – time interval (hours) to consecutive trips

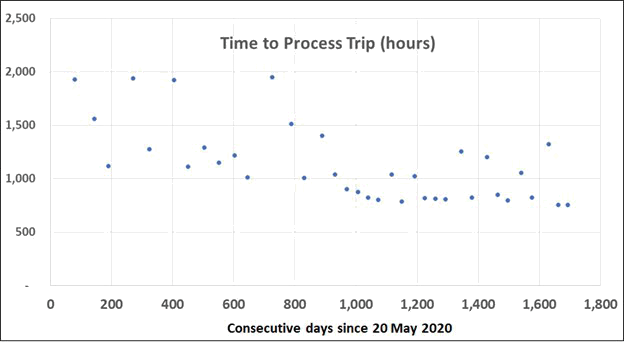
To a certain extent, an analyst can see in Graph 1 above that the increase in failure occurrences is occurring between the 800th and 1000th consecutive day. They can choose to move on with the RCA and find out what changed around this interval. However, Crow-AMSAA plots could offer more precise information on the changes as shown below.

Using Crow-AMSAA plots – A more elegant method

The data from Graph 1 above is transformed to a Crow-AMSAA logarithmic plot as illustrated in Graph 2 below. The raw data is attached here should the reader want to use it.  

Reliability engineering graph showing cumulative events over time with an inflection point, including a zoomed-in view.
Graph 2 – Crow AMSAA Plot highlighting Time to Trip inflection point on Oct 27th, 2022.

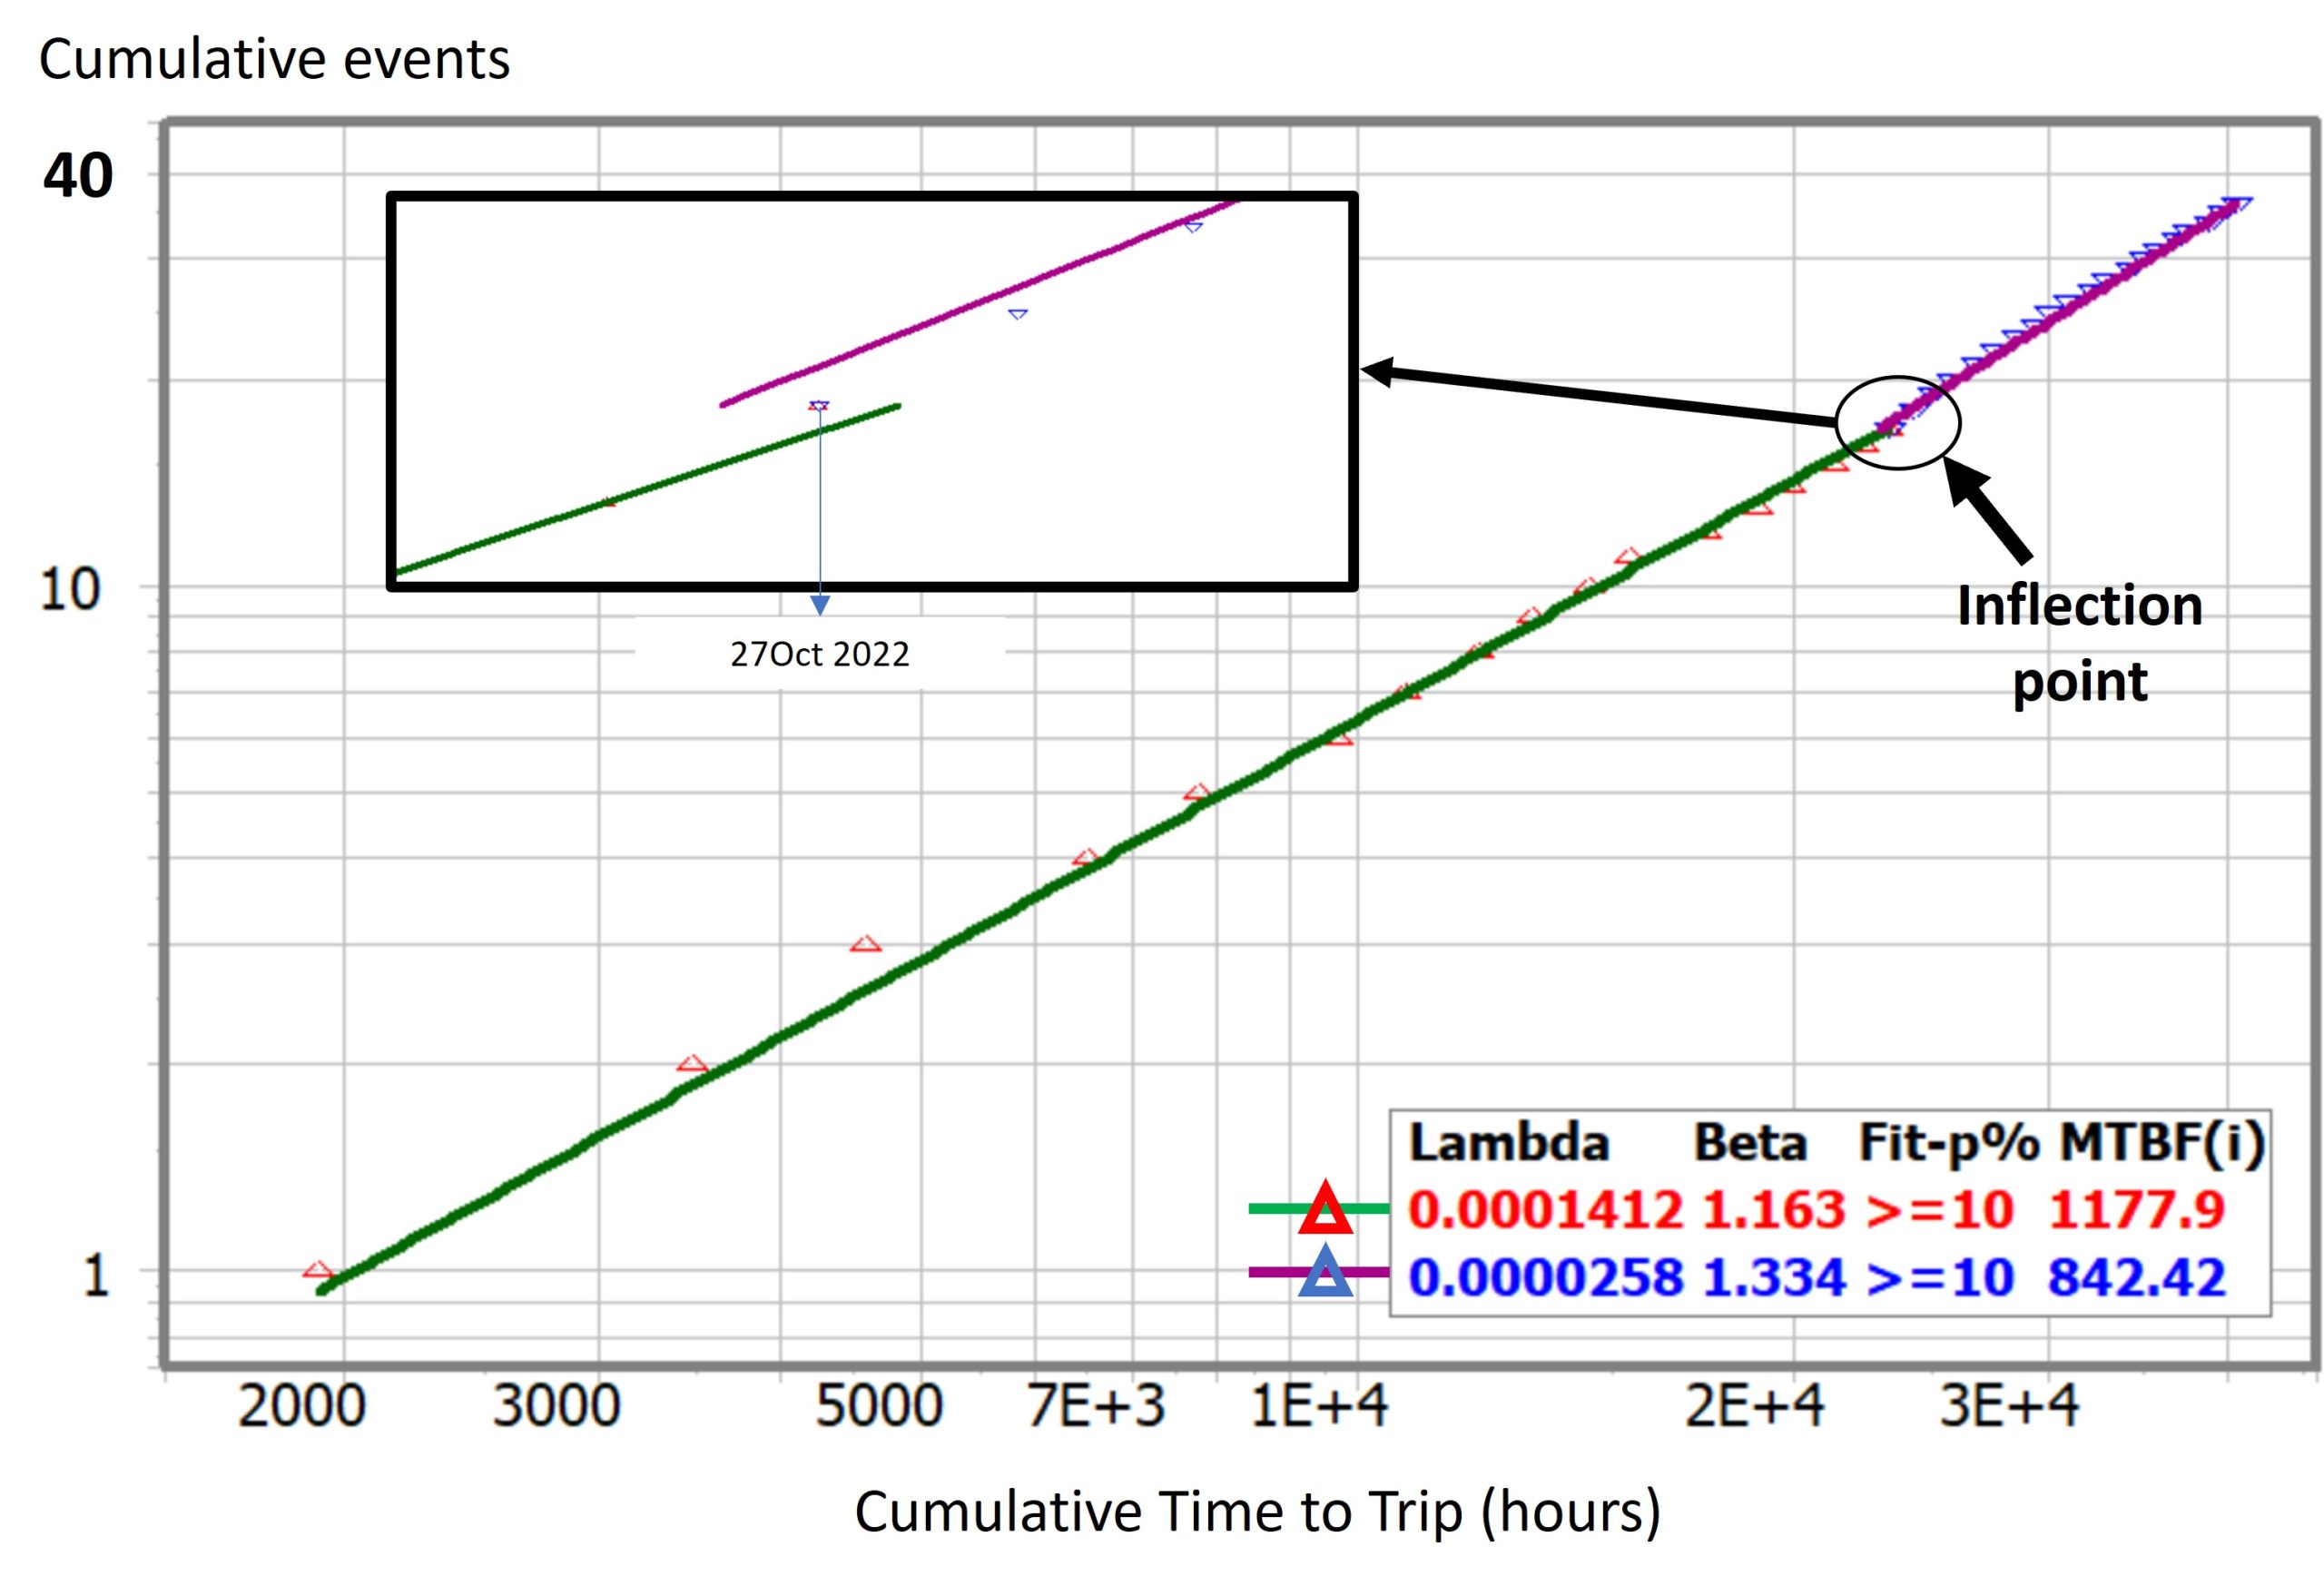
Graph 2 illustrates the inflection point where the initial line (green) changes to a steeper sloped line (pink). This change or inflection occurs precisely on October 27th, 2022. The successive slopes are quantified by the Beta value. The higher the beta value, the higher the slope. And the lower the time to failure. The correlation factors (r^2) are high (i.e. very close to 1) indicating good models for each individual segment.  

In this scenario, the operating system was pushed harder (over loaded) due to increases in production demand. The capabilities of the equipment were pushed to the limit, leading to more trips. The RCA will eventually highlight the procedures that were overlooked or lacking when the decision was made to increase production.

Conclusion

There is no dramatic change in inflection in Graph 2. However, the visualization is somewhat neater and more elegant. Providing straight lines and a clear inflection point. Additionally, the MTBF (Mean Time Between Failures) values are identified which can help assess the impact from one process output to another. MTBF values indicate that the average frequency of failures has increased by approximately 50%. This could help the operator quantify the financial impact of the changes in operational load. And financially justifying the RCA exercise as well as the mitigation measures to be implemented.

There is no absolute need to use the Crow AMSAA methodology for this exercise. The chronological data in Graph 1 would suffice. However, the Crow AMSAA plot provides more precise information, better visuals, and more quantitative decision-making values.

References

1. Robert B. Abernethy, The New Weibull Handbook, 5th Edition (2007), Section 9.1-9.2.

2. Nigel Comerford, Crow/AMSAA Reliability Growth Plots, 16th Annual Conference 2005 – Rotorua.

Filed Under: Articles, The Reliability Mindset

About André-Michel Ferrari

André-Michel Ferrari is a Reliability Engineer who specializes in Reliability Analytics and Modeling which are fundamental to improving asset performance and output in industrial operations.

André-Michel has approximately 30 years of industrial experience mainly in Reliability Engineering, Maintenance Engineering, and Quality Systems Implementation. His experience includes world-class companies in the Brewing, Semiconductor, and Oil & Gas industries in Africa, Europe and North America.

« Supplier reliability – shared responsibilities

Leave a Reply Cancel reply

Your email address will not be published. Required fields are marked *

The Reliability Mindset logo Photo of André-Michel FerrariArticles by André-Michel Ferrari
in the The Reliability Mindset: Practical Applications in Industry article series

Join Accendo

Receive information and updates about articles and many other resources offered by Accendo Reliability by becoming a member.

It’s free and only takes a minute.

Join Today

Recent Posts

  • Using Crow AMSAA Plots for RCAs
  • Supplier reliability – shared responsibilities
  • Do You Have Enough Data?
  • World Trade Center Collapse
  • What is Enterprise Asset Management?

© 2026 FMS Reliability · Privacy Policy · Terms of Service · Cookies Policy

Book the Course with John
  Ask a question or send along a comment. Please login to view and use the contact form.
This site uses cookies to give you a better experience, analyze site traffic, and gain insight to products or offers that may interest you. By continuing, you consent to the use of cookies. Learn how we use cookies, how they work, and how to set your browser preferences by reading our Cookies Policy.