
This article is adapted from Chapter 9 of my book, Measuring Manufacturing Effectiveness.
The book examines how manufacturing organizations define and apply performance metrics, and how those choices influence decisions, priorities, and outcomes across operations. While the chapters collectively form a structured framework, each chapter is written to address a specific dimension of manufacturing effectiveness and can be read independently.
Quality loss is often discussed in terms of defects and scrap. While those outcomes matter, they represent only the most visible expressions of a deeper issue: the ability of a manufacturing system to produce stable, predictable, and usable output.
Chapter 9 reframes quality loss through the lenses of yield, stability, and usable output. Rather than treating quality as a pass/fail condition, this chapter examines how variation influences what portion of production can actually be counted as usable output.
By viewing quality loss as a system property rather than a simple defect rate, this chapter aims to clarify why many quality metrics fail to reflect real operational performance, and why improving quality often requires changes beyond the quality function itself.
Quality Loss: Yield, Stability, and Usable Output
“Quality loss” describes the reduction in usable output that occurs after effective production time has been realized. It governs the final transition in the manufacturing time funnel:
Effective Production Time → Good Output Time
Quality loss is commonly reduced to a single concept, scrap rate. This interpretation is incomplete. Quality loss arises from distinct mechanisms that carry different implications for system health and improvement strategy.
Defining Quality
Within OEE, quality is defined as the fraction of produced output that meets requirements.
$$ \displaystyle \text{Quality}=\frac{\text{Good Output}}{\text{Total Output $$This expression defines quality strictly in terms of usability. It does not distinguish between varying sources or severities of nonconforming output.
Interpreting quality correctly requires separating structural yield loss from stability-related loss.
Quality Loss Is Not a Single Phenomenon
Figure 6 decomposes quality loss into two categories:
- Yield loss
- Stability loss
These categories reflect different system behaviors and demand different responses. Treating them as equivalent obscures root causes and weakens corrective action.
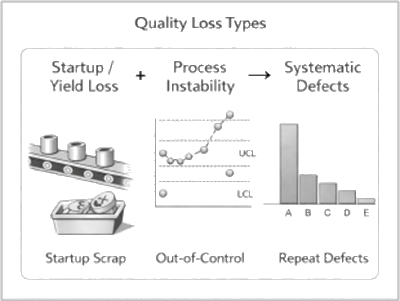
and stability loss as distinct mechanisms of quality loss resulting in
repeated patterns of defects.
Yield Loss
Yield loss refers to expected, repeatable loss that occurs during startup, adjustment, or transition to steady-state operation.
Common sources include:
- Startup scrap
- First-piece adjustment
- Tool seating and warm-up effects
- Process alignment
Yield loss is often predictable and implicitly accepted. It is frequently planned for indirectly through experience rather than explicitly accounted for.
Yield loss does not necessarily indicate a defective process. It reflects the reality that many manufacturing systems do not produce conforming output immediately upon restart.
Stability Loss
Stability loss refers to unpredictable, non-repeatable loss that occurs during nominal operation.
Common sources include:
- Random defects
- Process drift
- Environmental sensitivity
- Equipment instability
- Operator intervention
Stability loss is a signal of system instability. It often originates upstream in availability or performance behavior and manifests as quality loss.
Unlike yield loss, stability loss cannot be reliably planned for. It indicates degraded control.
Acting alone or in combination, yield loss and stability loss give rise to repeated, recognizable defect patterns. Practitioners often identify these patterns before they identify the loss mechanisms that produce them.
Yield Versus Stability: Why the Distinction Matters
Yield loss and stability loss may produce similar scrap quantities while representing very different system conditions.
- Yield loss is structural
- Stability loss is diagnostic
Reducing yield loss often involves improving startup procedures, tooling consistency, or setup methods. Reducing stability loss requires addressing variability, robustness, and upstream disturbances.
Treating all quality loss as yield loss masks instability. Treating all quality loss as stability loss leads to unrealistic expectations.
Quality Loss and Recovery Behavior
Quality loss is strongly influenced by restart and recovery behavior following downtime.
After a downtime event, production may resume before the process has stabilized. During this period:
- Scrap rates are elevated
- Adjustments are frequent
- Control limits may not yet be representative
These losses are often misclassified as performance inefficiency or operator error when their origin lies in recovery dynamics.
Quality Metrics and Interpretation
The quality component of OEE captures the fraction of output that is usable. It does not describe why output is nonconforming.
Interpreting quality metrics requires understanding:
- Whether loss is repeatable or random
- Whether loss is localized to startup or persists during steady operation
- Whether loss correlates with downtime or speed changes
Without this context, quality metrics invite overcorrection.
Quality as a System Outcome
Quality loss is rarely isolated. It is influenced by:
- Availability behavior
- Performance decisions
- Recovery dynamics
- Process capability
- Environmental control
Addressing quality loss in isolation often produces limited results. Sustainable improvement requires attention to upstream contributors.
Quality and Management Responsibility
Quality loss reflects decisions about how aggressively a system is operated, how recovery is managed, and how variability is controlled.
Management decisions regarding maintenance, operating windows, and recovery protocols directly affect quality stability. Quality metrics therefore reflect organizational choices as much as process capability.
Key Takeaways
- Quality loss governs the transition from effective production to usable output
- Quality is defined as the fraction of output that meets requirements
- Yield loss and stability loss are distinct mechanisms
- Yield loss is structural and often predictable
- Stability loss is diagnostic and signals system instability
- Quality loss is strongly influenced by recovery behavior
- Quality metrics require contextual interpretation
Quality loss represents the final filter between production effort and value creation. Understanding its sources is essential to interpreting manufacturing effectiveness as a whole.
This chapter is part of Measuring Manufacturing Effectiveness, a 12-chapter framework that examines how manufacturing performance metrics shape decision-making and improvement efforts.
The complete book brings together all chapters, along with figures, equations, and examples that place Availability, Performance, and Quality losses within a broader system of manufacturing measurement.
If you’d like access to the full framework, the book is available on Amazon here:
If you purchase Measuring Manufacturing Effectiveness through this link, it helps support the ongoing work of Accendo Reliability, which has generously hosted this serialized release.
Purchases made through this link help support the ongoing work of Accendo Reliability, which hosts this serialized article series.
Ray Harkins is the General Manager of Lexington Technologies in Lexington, North Carolina. He earned his Master of Science from Rochester Institute of Technology and his Master of Business Administration from Youngstown State University. He also teaches 60+ quality, engineering, manufacturing, and business-related courses such as Quality Engineering Statistics, Reliability Engineering Statistics, Failure Modes and Effects Analysis (FMEA), and Root Cause Analysis and the 8D Corrective Action Process through the online learning platform, Udemy.



Leave a Reply