What if there’s no lifetime data? Periodic product ships or sales data and returns (complaints, failures, repairs, or spares sales) contain reliability information. Neutrosophic statistics provide a way to make nonparametric estimates of products’ or parts’ reliability without lifetime data.
Distinguish Lifetime Data from Without…
Table 1. “Nevada” table of cohort sizes “Ships” and their failure counts (lifetimes) from https://mtbfreport.com/nevada-format/
| Ships | Jan | Feb | Mar | Apr | May | June | |
| Jan | 5357 | 3 | 6 | 5 | 4 | 1 | 8 |
| Feb | 4222 | 7 | 9 | 12 | 23 | 16 | |
| Mar | 2345 | 2 | 13 | 4 | 23 | ||
| Apr | 6132 | 4 | 8 | 12 | |||
| May | 2456 | 2 | 10 | ||||
| June | ??? | ??? | |||||
| Returns | 20512 | 3 | 13 | 16 | 33 | 38 | 69 |
Table 2. Without lifetimes, the cohort “Ships” column and the bottom row “Returns” (failures, repairs, complaints, spare parts’ sales, etc.) from bottom row in Nevada table 1.
| Ships | Returns | |
| Jan | 5357 | 3 |
| Feb | 4222 | 13 |
| Mar | 2345 | 16 |
| Apr | 6132 | 33 |
| May | 2456 | 38 |
| June | ??? | 69 |
Periodic ships and returns counts, without lifetimes, are statistically sufficient to make nonparametric reliability function estimates. Ships and returns data are available, with a little work, from revenue and service cost data required by GAAP. Parts’ ships and returns counts are available from product data, BoMs, and gozinto theory [George, 2023].
Neutrosophic statistics provides an alternative, to simulate feasible Nevada tables of cohort failure counts that add up to the period returns and allow the use of the Kaplan-Meier reliability estimator, without lifetime data.
Nonparametric Reliability Estimators from Ships and Returns
The nonparametric maximum likelihood reliability function estimator (npmle) maximizes likelihood, ΠPoisson[Returns(t), λG(t)], t=1,2,…, as a function of nondecreasing service time distribution function G(t) = 1-R(t) (R(t)=reliability function) and λ, an assumed or estimated Poisson ships rate [George, July 2022]. This is because the output of M/G/∞ self-service system is Poisson [Mirasol]. The nonstationary likelihood ΠPoisson[Returns(t), λ(t)G(t)] works for nonstationary M(t)/G/∞ too.
The nonparametric least squares actuarial failure rate function estimator (nplse) a(s) minimizes difference between observed returns and actuarial hindcasts ∑n(t-s)a(s), s=1,2,…t with installed base n(t-s). The actuarial failure rate function a(s) =-(R(s+1)-R(s))/R(s).
The nonparametric Kaplan-Meier reliability estimator requires lifetime data (or a facsimile). The Greenwood variance of the Kaplan-Meier estimator errs, because it ignores cohort size randomness [George, May 2025]. So estimate cohort reliability variance-covariance matrix from Nevada table cohort lifetimes for confidence bounds on Kaplan-Meier npmle [George “Uncertainty”], if you have lifetime data. This could work for neutrosophic simulated lifetime data in Nevada tables too.
Cohort Lifetimes are Unknown Without Lifetime Data! So Simulate Them?
Table 2 “Returns” or failures in any period could have come from any previously or concurrently shipped cohort! How many combinations of a specified number k of nonnegative integers (periodic cohort returns) could add up to a specified sum S (monthly returns or failures)?
(S+k-1)!/(S!*(k-1)!) = Excel COMBIN(S+k-1,k-1)
Table 3. How many combinations??? S denotes period returns Jan.-May from table 2.
| k | 1 | 2 | 3 | 4 | 5 |
| S | 3 | 13 | 16 | 33 | 38 |
| COMBIN(S+k-1,k-1) | 1 | 14 | 153 | 7140 | 111930 |
It is impractical to enumerate all combinations, so simulate some. This is not a “Bootstrap” method [https://en.wikipedia.org/wiki/Bradley_Efron/]. Bootstrap methods resample from known or estimated distribution(s). No, it’s a simple “Neutrosophic” method [Smarandache, Alhasan et al, and Dasan et al].
What is Neutrosophistry?
“Of or relating to a general form of logic in which each proposition has separate values for truth, falsehood, and indeterminacy” [https://en.wiktionary.org/wiki/neutrosophic/]. Google says, “Neutrosophic statistics is a generalization of classical and interval statistics that analyzes data containing indeterminacy—such as vague, incomplete, or contradictory information.” Monthly ships and returns counts obviously (logic) contain reliability information, without lifetime data by cohort. Why not construct (proposition) Nevada tables with cohort returns counts by month that add up to observed monthly returns sums? Then compute Kaplan-Meier reliability estimate for each simulation, repeat, and average the Kaplan-Meier estimates? Why not compute Kaplan-Meier reliability estimates from each simulated cohort and estimate their variance-covariance matrix? Could even weight (truth, falsehood, and indeterminacy) each simulated Nevada table cohort with observed cohort sizes, ships, population proportions, failure count proportions?
Table 4. Neutrosophic Nevada table Excel formulas; bottom row “Returns” come from table 2.
| A | B | C | D | E | F | |
| 1 | Jan | Feb | March | April | May | |
| 2 | Jan | 3 | =RANDBETWEEN(0,13) | =RANDBETWEEN(0,16) | Etc. | Etc. |
| 3 | Feb | =13-C2 | =RANDBETWEEN(D2,16) | Etc. | Etc. | |
| 4 | Mar | =16-SUM(D2:D3) | Etc. | Etc. | ||
| 5 | Apr | Etc. | Etc. | |||
| 6 | May | Etc. | ||||
| 7 | Returns | 3 | 13 | 16 | 33 | 38 |
Notice that the January cohort’s RANDBETWEEN(0,13), RANDBETWEEN(0,16),… could be larger than subsequent 13-C2, RANDBETWEEN(D2,16),… simulated returns? In general, simulated monthly returns may be decreasing even though reliability is changing by cohort. One solution to this is to scramble the formulas in each column randomly, although the combinations in table 3 grow drastically.
Neutrosophic Statistics
Simulate possible cohort lifetimes that add up to total returns (bottom row in a Nevada table) and compute the Kaplan-Meier reliability estimates repeatedly. Excel’s RANDBETWEEN() function returns integers. An Excel Macro or VBA code could repeat this, generate larger samples, and scramble the column entries.
This is not the same as “Neutrosophic Reliability” which computes system reliability functions from component parametric reliability functions with confidence intervals on reliability function parameters [Alhasan et al].
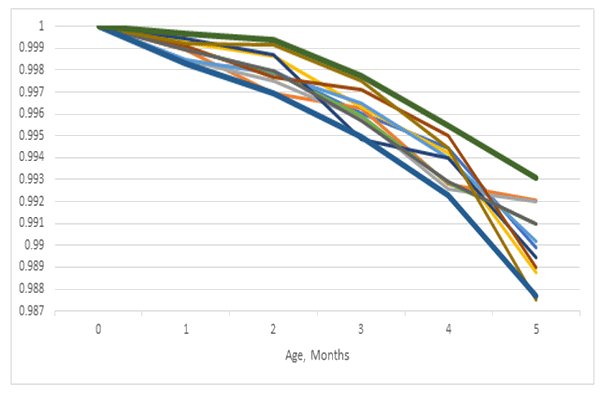
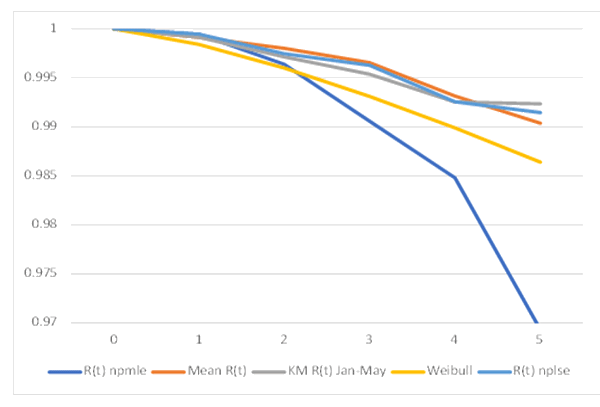
The simulated neutrosophic “Mean R(t)” and the least-squares reliability estimates “R(t) nplse” from ships and returns coincide with the Kaplan-Meier maximum likelihood reliability estimate “K-M R(t) Jan-May” from the original table 1 lifetime data. I redid 10 neutrosophic simulations with the same result: the neutrosophic “Mean R(t)” agrees with Kaplan-Meier and nplse reliability estimates.
The maximum likelihood reliability estimate (lowest blue line “R(t) npmle”) from monthly ships and returns counts disagrees. The simulated neutrosophic mean R(t) seems better than the “R(t) npmle” npmle without lifetime data! The npmle from ships and returns assumes Poisson ships. Mean ships = 4102 and variance = 2,876,673 is not very Poisson.
Another Example Differs
This example is from a Nevada table with 18 cohorts and failure counts for 18 periods. All items failed in the first seven cohorts. Reliability estimates go to zero.
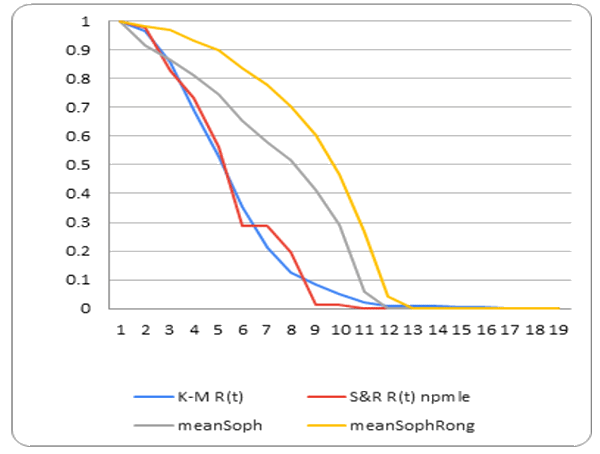
Because the data showed all items in seven cohorts failed, the neutrosophic simulation formulas in table 4 didn’t work; they sometimes simulate more cohort failures than their cohort sizes “meanSophRong”! Table 5 shows Excel formulas that limit cohort failures to be no more than cohort sizes. The column formulas choose RANDBETWEEN 0 and the larger of cohort survivors and observed column failures minus earlier failures in same period “meanSoph”.
Table 5. Excel spreadsheet formulas for Nevada table of neutrosophic failure simulation with many failures.
| B | C | D | E | F | |
| 1 | Ships | 1 | 2 | 3 | 4 |
| 2 | 47 | 3 | =RANDBETWEEN(0,MAX(0,MIN($B2-$C2,D19))) | =RANDBETWEEN(0,MAX(0,MIN($B2-SUM($C2:D2),E19))) | Etc. |
| 3 | 41 | =13-C2 | =RANDBETWEEN(0,MAX(MIN($B3-$D3,E$19)-E2,0)) | Etc. | |
| 4 | 35 | =16-SUM(D2:D3) | Etc. | ||
| Etc. | Etc. | ||||
| 19 | Sum | 3 | 13 | 16 | 33 |
What Now?
Compare alternatives: Kaplan-Meier reliability estimates vs. nonparametric maximum likelihood estimate (npmle) of reliability from ships and returns vs. neutrosophic simulated mean of Kaplan-Meier reliability estimates. Neutrosophic a reliability beats the npmle reliability from ships and returns in the first example, and, in the second, the neutrosophic mean reliability appears off. It looks like the neutrosophic simulation and average of Kaplan-Meier estimates works when reliability is good. But why?
What are the effects of failures vs. cohort sizes: many vs. few failures, high vs. low reliability, degree of censoring? What are the effects of random ships or cohort sizes?
It’s easy to show a stochastic process is nonstationary. OTOH, it’s hard to disprove individual periodic ships cohorts are not Poisson from samples of size one, each cohort [Nelson and Leemis]. Check for Poisson in nonstationary M(t)/G/infinity model for npmle from ships and returns? “…under a condition! A constant or increasing arrival (inputs or ships) rate satisfies the condition” [George, “…Note…” Aug. 2025].
Neither example satisfies these conditions! First example slope is -389 per month of average ships 4102 and variance is 2,876,673, second example slope is-0.68 per period of average ships 39.5 and variance 31.7. Poisson mean almost equals variance! OK for second example except for slope.
I will explore neutrosophic statistics for recurrent (renewal?) process reliability and its growth or deterioration. I will include cohort simulations and estimate the variance-covariance matrix of reliability estimates. I will use neutrosophic reliability estimates to estimate confidence bands [Hall and Wellner]. What does neutrosophic simulated Kaplan-Meier variance-covariance matrix represent? It may not be the variance-covariance matrix of cohort Kaplan-Meier reliability estimates. But why not simulate neutrosophic cohort Kaplan-Meier variance-covariance matrix [George 2024]? WIP. Please send your ships and returns counts to pstlarry@yahoo.com if you want nonparametric reliability estimates and confidence bands, without lifetime data, from data required by GAAP.
References
Kawther F. Alhasan, A. A. Salama, and Florentine Smarandache, “Introduction to Neutrosophic Reliability Theory”, International Journal of Neutrosophic Science, Vol.15 No. 1, pp. 52-61, 2021
M. Arockia Dasan, L. Lucase, Abdulrahman AlAita, Muhammad Aslam, and E. Bementa, “A Decision-Making Problem for Smartphone Selection Using Neutrosophic Distance Measures”, Advances in Fuzzy Systems, March 2026
W. J. Hall and Jon A. Wellner, “Confidence Bands for a Survival Curve from Censored Data”, Biometrika, Vol. 67, No. 1, pp.133-143, April 1980
Noel Mirasol, “The Output of an M/G/Infinity Queuing System is Poisson,” Operations Research, Vol. 11, No. 2, pp. 282-284, Mar.-Apr., 1963
Barry L. Nelson and Lawrence M. Leemis, “The Ease of Fitting but Futility of Testing a Nonstationary Poisson Processes From One Sample Path,” Proceedings of the 2020 Winter Simulation Conference, IEEE, 2020
Florentin Smarandache, “Neutrosophic Theory and its Applications : Collected Papers – vol. 1”, 2014
References by George
“Gozinto Theory…”, https://accendoreliability.com/gozinto-theory-parts-installed-base/, April 2021
“Forecast Parts’ Demands…”, https://accendoreliability.com/forecast-parts-demands-without-life-data-for-a-nonstationary-process/, July 2022
“Uncertainty in Population Estimates”, https://accendoreliability.com/uncertainty-in-population-estimates/, Dec, 2022
“Gozinto Theory…”, https://accendoreliability.com/gozinto-theory-parts-installed-base/, Sept. 2023
“Kaplan-Meier Ignores…”, https://accendoreliability.com/kaplan-meier-ignores-cohort-variability/, Oct. 2024
“Kaplan-Meier Reliability: What Could Possibly Go Wrong”, https://accendoreliability.com/kaplan-meier-reliability-what-could-possibly-go-wrong/, May 2025
“Progress in…”, https://accendoreliability.com/progress-in-usaf-engine-logistics/, August 2025
“A Note on Reliability Estimation…”, https://accendoreliability.com/a-note-on-reliability-estimation-without-life-data/, August 2025



Leave a Reply