
Traditional electronics reliability engineering began during the period of infancy in solid state electronic hardware. The first comprehensive guide to Failure Prediction Methodology (FPM) premiered in 1956 with the publication of the RCA release TR-1100: “Reliability Stress Analysis for Electronic Equipment” presented models for computing rates of component failures. “RADC Reliability Notebook” emerged later in 1959, followed by the publication of a military handbook know as that addressed reliability prediction known as Military Handbook forReliability Prediction of Electronics Equipment (MIL HNBK 217) . All of these publications and subsequent revisions developed the FPM based on component failures in time for deriving a system MTBF as a reference metric for estimating and comparing the reliability of electronics systems designs. At the time these documents were published it was fairly evident that the reliability of an electronics system was dominated by the relatively short life entitlement of a key electronics component, vacuum tubes.
In the 21st century, active components have significant life entitlements if they had been correctly manufactured and applied in circuit. Failures of electronics in the first five or so years are almost always a result of assignable causes somewhere between the design phase and mass manufacturing process. It is easy to verify this from a review of root causes of verified failures of systems returned from the field . Almost always you will find the cause an overlooked design margin, an error in system assembly or component manufacture, or from accidental customer misuse or abuse. These causes are random in occurrence and therefore do not have a consistent failure mechanism. They are not in general capable of being modeled or predicted.
There is little or no evidence of electronics FPM correlating to actual electronics failure rates over the many decades it has been applied. Despite the lack of supporting correlating evidence, FPM and MTBF is still used and referenced for a large number of electronics systems companies. FPM has shown little benefit in producing a reliable product, since there has been no correlation to actual causes of field failure mechanisms or rates of failure. It actually may result in higher product costs as it may lead to invalid solutions based on invalid assumptions (Arrhenius anyone?) regarding the cause of electronics field failures.
It’s time for a new frame of reference, a new paradigm, for measurement for confirming and comparing the capability of electronics systems to meet their reliability requirements. The new orientation should be based on the stress-strength interference perspective, the physics of failures, and material science of electronics hardware.
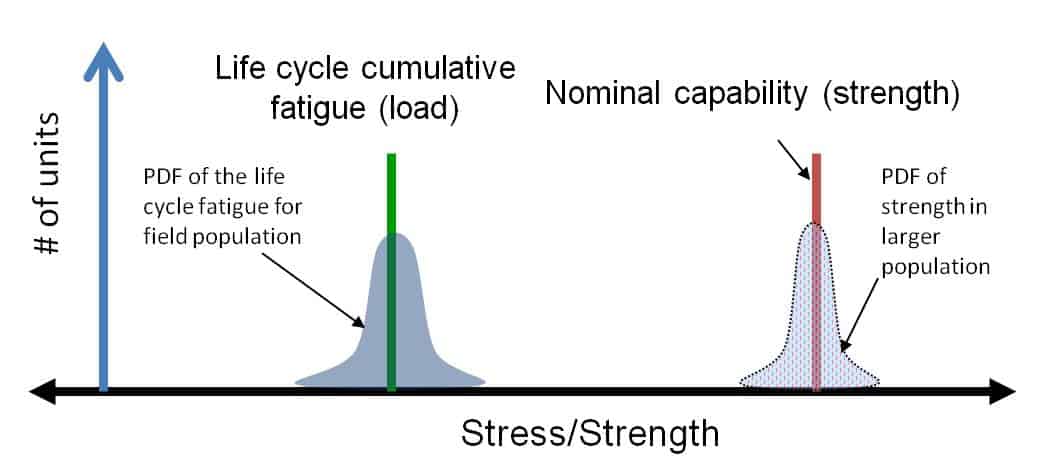
The new metric and relationship to reliability is illustrated in a stress-strength graph as shown in figure 1. This graphic shows the relationship between a systems strength and the stress or load it is subjected to. As long as the load is less than the strength, no failures occur.
In the stress-strength graph in figure 2, anywhere the load to a system exceeds the system’s strength is where the two curves overlap and failures occur. This relationship is true for bridges and buildings as well as electronics system.
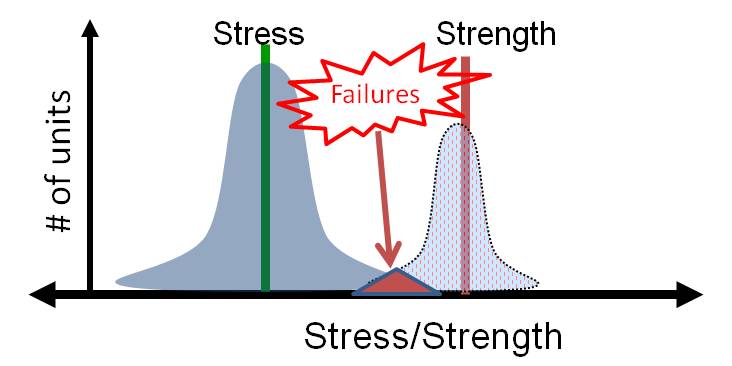
This relationship between stress and strength and failures correlates with our common sense understanding that the greater the inherent strength a system has relative to environmental stress, the more reliable it will be. We can refer to the space between the mean strength and the mean stress as the reliability margin shown in figure 3.
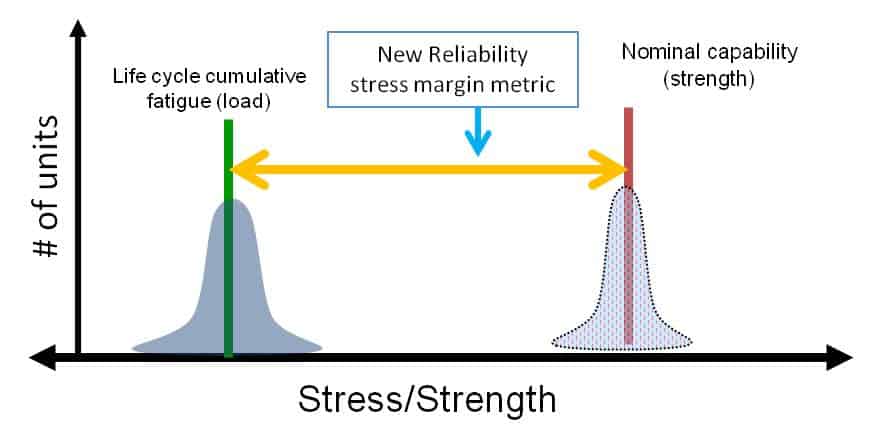
It is similar to a safety margin except with an electronics assembly we derive the mean of the strength entitlement of standard electronics PWBA materials. The mean strength can be found relatively quickly in a stepped stress limit evaluation (a.k.a. HALT) compared to long duration estimated worst case stress simulation testing, where the fundamental goal is to establish a time-to-failure metric.
Of course the balance is that we must consider the competitive market and build the unit at the lowest costs. What is probably not be known to most electronics companies is how strong standard electronic materials and systems can actually be in relation to thermal stress, since so few companies are actually testing to thermal empirical stress operational limits, with thermal protection defeated. Many complex electronics systems can operate from -60°C or lower to +130 °C or greater using standard components. Typically it is only one or two components that keep a system from reaching stress levels that are at the fundamental limit of technology (FLT). The FLT is the point at which the design capability cannot be increased with standard materials. Sometimes designs have significant thermal operating margins without modifications, which can be used to produce shorter and more effective combined stress screens such as HASS (Highly Accelerated Stress Screens) to protect against manufacturing excursions that result in latent defects.
In most applications of electronics systems, technological obsolescence comes well before components or systems wear out. For most electronics systems we will never empirically confirm their total “life entitlement” since few systems are likely to be operational long enough to have “wear out” failures occur. Again it is important to emphasize that we are referring more to the life of solid state electronics and less to mechanical systems where fatigue and material consumption results in wear out failures.
Reliability test and field data are rarely published but there is one published study with data showing a correlation between empirical stress operational margin beyond specifications and field returns. Back in 2002, Ed Kyser, Ph.D., and Nahum Meadowsong from Cisco Systems gave a presentation titled “Economic Justification of Halt Tests: The relationship between operating margin, test costs, and the cost of field returns” at the IEEE/CPMT 2002 Workshop on Accelerated Stress Testing (now the IEEE/CPMT Workshop on Accelerated Stress Testing and Reliability, ASTR). In their presentation they showed the graph of data on differences in thermal stress operational margin versus the normalized warranty return rate on different line router circuit boards as is shown in Figure 4.
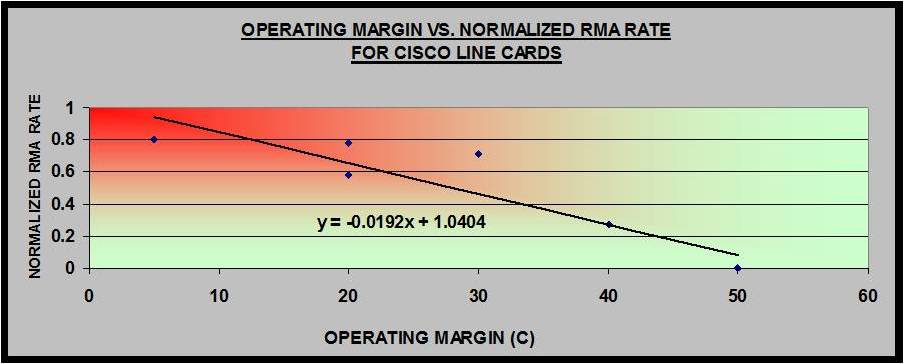
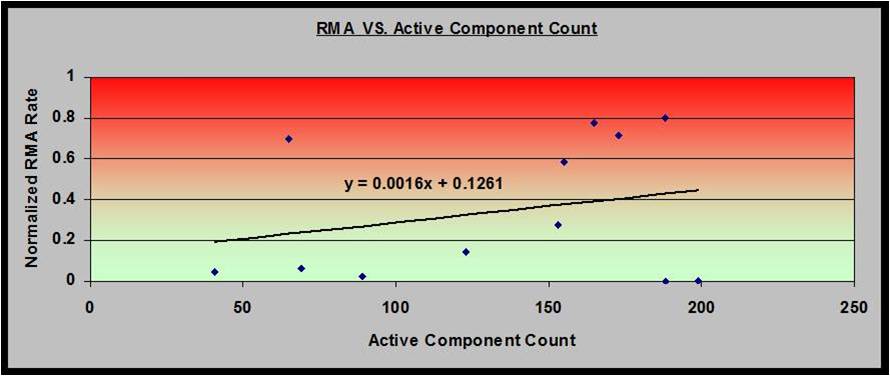
The graph shows the correlation between the thermal margin and the RMA (Return Material Authorization), i.e. the warranty return rate. A best fitting curve with this scatter diagram shows a probabilistic relationship between thermal operational margin and warranty returns. It indicates that the lower the operational margin, the higher probability of its return. Cisco also compared the relationship between the number of parts (on a larger range of product) and the return rate. The graph of that data is shown in figure 5. The relationship between thermal margins versus return rates is ten times stronger than the relationship between board parts counts versus return rates.
This makes sense from a stress-strength relationship. No matter how long a chain is, it is only as strong as the weakest link in that chain. No matter how many parts on the PWBA, the designs tolerance to variation in manufacturing and end-use stress is dependent on the least tolerant part.
For operational reliability or “soft failures” in digital electronics, the relationship between thermal limits and field operational reliability is less obvious since again most electronics companies do discover and therefore do not compare empirical thermal limits with rates of warranty returns. In mass production of high speed digital electronics, the variations in components and PWBA manufacturing can lead to impedance variations and signal propagation (strength) that overlap the worst case stresses in the end use (load) leading to marginal operational reliability. It is very challenging to determine a root cause for operational reliability that is marginal or intermittent, as the subsystems will likely function correctly on a test bench or in another system and considered a CND (Cannot Duplicate) return. Many times the marginal operational failures observed in the field can be reproduced when the system is cooled or heated to near the operational limit. Heating and cooling the system skews the impedance and propagation of signals, essentially simulating variations in electrical parametrics from mass manufacturing. If companies do not apply thermal stress to empirical limits, they will never discover and be able to utilize this benefit to find difficult to reproduce signal integrity issues.
Faster and lower reliability test costs are becoming more critical in today’s fast pace of electronics development. Most conventional reliability testing that is done to some pre-established stress above spec or “worst case” field stress takes many weeks if not months, and result in minimal reliability data. Finding electronics systems strength by HALT methods is relatively very quick, typically taking only a week or less to find, and with fewer samples. Even if no “weak link” is discovered during HALT evaluations, it always provides very useful variable data on empirical stress limits between samples and design predecessors. Empirically discovered stress limits in an electronics system design are very relevant to potential field reliability and especially thermal stress an operational reliability in digital systems. Not only can stress limits data be used for making a business case for costs of increasing thermal or mechanical margins, but it can also be used for comparing the consistency of strength between samples of the same products. Large variations of strength limits between samples of a new system can be an indicator of some underlying inconsistent manufacturing processes. If the variations are large enough some percentage will fail operationally because the end-use stress conditions exceed the variation in the products strength.
As with any major paradigm shift, a move from using the dimension of time to the dimension of stress as a metric for reliability estimations, there will be many details and challenges yet to be determined on how best to apply it and use the data derived from it. Yet from a physics and engineering standpoint a new reference of stress levels as a metric has a much stronger potential for relevance and correlation to field reliability than the previous FPM with broad assumptions on the causes of field operational and hardware unreliability in current and future electronics systems. If we begin today using stress limits and combinations of stress limits as a new reference for reliability assessments we will discover new correlations and benefits in developing better test regimens and finding better reliability performance discriminators resulting in improving real field reliability at the lowest costs.

Leave a Reply