Why ISO 281’s $-a_1-$ Factor Changed in 2007
And what it teaches us about using statistical models beyond their validated range
Most bearing life calculations begin with the basic rating life, L₁₀, which is defined as the life at which 90% of a population of apparently identical bearings is expected to survive under specified operating conditions. In practice, however, engineers are frequently asked to design for much higher reliability levels. Warranty commitments, maintenance planning, wind turbine gearboxes, aerospace applications, and EV drive units often require reliability targets of 99% or higher.
To convert the basic rating life to another reliability level, ISO 281 uses the reliability life modification factor, a₁. For many engineers, this is simply a value taken from a table or calculated automatically by software. What is less well known is that the statistical basis for a₁ changed substantially with the publication of ISO 281:2007.
The earlier editions of ISO 281 were based on a two-parameter Weibull distribution. While this approach described bearing life well over the reliability range supported by available endurance data, it became increasingly inaccurate when extrapolated to very high reliability levels. As additional endurance testing became available over several decades, it became evident that the original model underestimated bearing life in the extreme upper tail of the distribution.
Recognizing this, the ISO technical committee revised the statistical model in ISO 281:2007. The revised formulation produces values that are nearly identical to the earlier standard at commonly used reliability levels but provides a better representation of observed bearing behavior above 99% reliability.
Although this article focuses on rolling bearings, the underlying lesson applies much more broadly. Every statistical model has limits. Using a model beyond the range for which it has been validated should always be recognized as an extrapolation, regardless of how easily the calculation can be performed.
Where a₁ Came From
The reliability factor a₁ was introduced to allow engineers to estimate bearing life at reliability levels other than the 90% survival level used to define L₁₀.
The concept first appeared in the 1977 revision of ISO/R 281 and was retained in ISO 281:1990. The derivation is straightforward. Assuming a two-parameter Weibull distribution, the life ratio corresponding to any reliability level can be obtained by anchoring the distribution at the L₁₀ point.
The resulting expression is:
$$ \displaystyle a_1=\left(\frac{\ln{\left(\frac{100}{S}\right)}}{\ln{\left(\frac{100}{90}\right)}}\right)^{1/e} $$S here is reliability expressed as a percentage. Set S = 90 and a₁ collapses to 1, as it must. Set S = 99 and the equation returns 0.21. This is the formula that produced every a₁ table printed from the late 1970s through the 1990s, including the version most engineers still mean when they say “the 1990 standard.” It is clean, it is defensible, and it was calibrated against endurance data clustered around 90% reliability, which is exactly where it remained trustworthy.
Where the Model Stopped Matching the Data
The limitations of the original model became apparent only after manufacturers accumulated many years of endurance testing and field experience.
Studies referenced by the ISO technical committee, including work from SKF and other researchers, showed that actual bearing populations survived longer than predicted by the original two-parameter Weibull model at very high reliability levels.
This difference becomes important because the original equation continues to decrease toward zero as reliability approaches 100%. The experimental data did not show the same behavior. Instead, the reduction in life became much less severe at the highest reliability levels.
The committee did not conclude that the original Weibull model was incorrect. Rather, it concluded that the model did not adequately represent the upper tail of the observed life distribution.
That distinction is important.
The original model remained appropriate near the reliability range where it had been developed. The discrepancy appeared only when engineers attempted to extend the calculation well beyond that range.
This explains an often-overlooked feature of ISO 281:1990. Although the equation could be evaluated for any reliability, the published tables stopped at 99%. The committee deliberately avoided publishing values that were not adequately supported by experimental evidence.
The 2007 Fix: A Third Parameter, and a Floor
ISO 281:2007 is remembered mainly for introducing aISO, the factor that folds the fatigue load limit, Cu, into the life calculation — the recognition that modern, clean, well-lubricated bearing steel can run essentially indefinitely below a certain Hertzian contact stress. The change to a₁ is the same idea applied to the reliability statistics. The committee moved from a two-parameter Weibull distribution to a three-parameter one, adding a term, Cγ, that sets an asymptotic floor on the life ratio instead of letting it run to zero.
$$ \displaystyle a_1=C_\gamma+\left(1-C_\gamma\right)\left(\frac{\ln{\left(\frac{100}{S}\right)}}{\ln{\left(\frac{100}{90}\right)}}\right)^{1/e}$$With the calibrated constants the committee settled on — Cγ = 0.05 and e = 1.5, so that 1/e = 2/3 — this becomes the actual equation published in ISO 281:2007:
$$ \displaystyle a_1=0.05+0.95\left(\frac{\ln{\left(\frac{100}{S}\right)}}{\ln{\left(\frac{100}{90}\right)}}\right)^{2/3} $$Setting Cγ = 0 collapses this exactly back to the 1990 formula. The 1990 model, in other words, is simply the special case of the 2007 model with no asymptotic floor, confirmation that the committee was not throwing out the old approach so much as recognizing it was an incomplete version of a more general one. The 0.05 floor and the e = 1.5 slope were chosen to fit the confidence bounds of the accumulated endurance data, not picked for mathematical convenience.
Comparing the Two Curves
The numbers tell the story better than the algebra. Table 1 lists both formulas side by side across the reliability range; Figure 1 plots them on a reliability-probability axis, which stretches out the high-reliability tail where the two models actually disagree.
| Reliability S (%) | a₁ — 1990 | a₁ — 2007 |
|---|---|---|
| 90 | 1.00 | 1.00 |
| 95 | 0.62 | 0.64 |
| 96 | 0.53 | 0.55 |
| 97 | 0.44 | 0.47 |
| 98 | 0.33 | 0.37 |
| 99 | 0.21 | 0.25 |
| 99.5 | — | 0.17 |
| 99.9 | — | 0.09 |
| 99.95 | — | 0.08 |
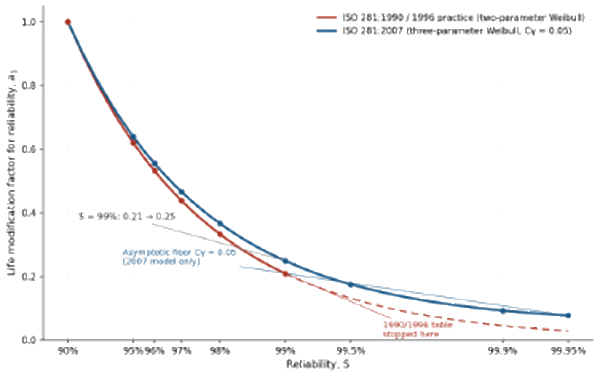
Through 95–97% reliability, the two curves are practically indistinguishable, and any quality plan checking L5 or similar will never notice the difference. By 99% reliability, the gap is already 0.21 versus 0.25 — close to 20% more credited life under the 2007 model for an identical target reliability. Beyond 99%, the 1990 formula has nothing to offer at all; the 2007 model keeps going cleanly out to 99.95%, flattening toward its 0.05 floor exactly the way the underlying endurance data does.
What This Actually Changes on the Calculation Sheet
For routine work — sizing a bearing to L10 or checking L5 against a quality target — this entire history is academic. The two formulas agree closely enough that the choice of standard year will not move a design decision. It stops being academic the moment the application calls for a high-reliability life calculation, and that moment comes up more often than the table’s small numbers might suggest. A few places it shows up directly:
- Warranty reserve calculations, where the credited bearing life at 99% or 99.9% reliability feeds directly into a financial provision
- Maintenance and inspection interval planning, where the interval is set against a target survival probability, not L10
- Drivetrain and e-axle sizing margins, where bearing life is one input into a system-level reliability budget
- Aerospace and other safety-critical certification submittals, which routinely specify reliability levels well above 99%
- Wind turbine gearbox design life, where 20-year field exposure at high reliability is the entire point of the calculation
- EV drive unit durability targets, where warranty periods are increasingly written against high-reliability survival requirements rather than a simple L10 check
In every one of these, the model underneath the table matters as much as the table itself. Anyone who has been hand-extrapolating the 1990 equation past 99% reliability — and it happens, because a formula in a spreadsheet does not announce where its validated range ends — has been working from a curve the original standard explicitly declined to publish. Most life-calculation software will compute a₁ at any reliability you type in, 99.99% included, without a warning that the underlying model was never validated there. Software performs mathematics. It does not perform engineering judgment, and that part is still the engineer’s job. The 2007 model is not just a refinement; it is the answer to a question the 1990 standard knew it could not answer and said so by stopping the table at 99%.
A Footnote on ISO 16281
Worth knowing if you are doing this calculation today: ISO 16281 (formerly ISO/TS 16281), which handles universally loaded bearings with clearance, misalignment, and uneven load sharing across rolling elements, does not touch a₁ at all. It inherits the 2007 equation unchanged and applies it on top of a more detailed reference life, L₁₀r, built from an internal load-distribution analysis rather than the closed-form C/P calculation. The reliability statistics did not need fixing twice. Only the life estimate feeding into them did.
The Larger Point
ISO/TC 4 had something like sixty years of accumulated endurance data before it revised a₁, and even then, the fix was a targeted one: keep the Weibull framework, add a third parameter, recalibrate against the data that had been quietly disagreeing with the old curve for years. Most of us doing reliability work on a single program will never have sixty years of data, or even sixty failures. What we can borrow from this episode is the discipline behind it — know exactly where your model was calibrated, treat anything outside that range as an extrapolation rather than a result, and remember that a Weibull tail that has never been checked against real failures is an assumption wearing the costume of a calculation.
The principle doesn’t stop at bearings. Whether you’re fitting a Weibull distribution to a handful of warranty returns, building an accelerated life model from a six-week test program, sizing a reserve from a field failure curve, or certifying a gearbox against a contractual reliability target, the same rule applies: every statistical model is only as trustworthy as the data that built it. Extrapolation isn’t wrong — it’s often the only option an engineer has on a real schedule. But it should always be recognized for what it is, and labeled accordingly, rather than handed to a customer or a finance team dressed up as a validated result.
George Box put the underlying idea better than most engineering standards ever will:
“All models are wrong, but some are useful.” — George Box
ISO 281:2007 is a reminder of what that looks like in practice. A useful model doesn’t get discarded the moment it’s shown to be incomplete — it gets refined where the evidence demands it, and trusted exactly as far as the evidence allows. The committee didn’t abandon Weibull. It refined it. That’s exactly how engineering should work.
Sources
ISO 281:1990, Rolling bearings — Dynamic load ratings and rating life.
ISO 281:2007, Rolling bearings — Dynamic load ratings and rating life, 2nd edition.



Leave a Reply